Class 12 TBSE Economics Suggestion 2026
Class 12 Micro Economics
- Chapter 1 Introduction to Economics
- Chapter 2 Consumer Equilibrium
- Chapter 3 Demand
- Chapter 4 Elasticity of Demand
- Chapter 5 Production
- Chapter 6 Cost
- Chapter 7 Supply
- Chapter 8 Revenue
- Chapter 9 Producer Equilibrium
- Chapter 10 Perfect Competition
- Chapter 11 Non-Competitive Market
- Chapter 12 Market Equilibrium with Simple Applications
Class 12th Board ECONOMICS Suggestion 2026
BEST & 1ST CUET COACHING AT AGARTALA
Class 12 Micro Economics Chapter-1 Introduction to Economics
QUESTIONS SOLVED
- What to produce?(a) What to produce refers to a problem in which decision regarding which goods and services should be produced is to be taken.(b) Since its resources are limited, every economy has to decide what commodities are to be produced and in what quantities.(c) ‘The guiding principle for an economy here is to allocate resources in such a way that gives maximum aggregate utility to the society.
- How to produce?(a) How to produce refers to a problem in which decision regarding which technique of production should be used is made.(b) Goods and services can be produced in two ways: by using labour intensive techniques, and by using capital-intensive techniques.(c) The guiding principle for an economy in such a case has to decide about the techniques of production on the basis of cost of production. Those techniques of production should be used which lead to the least possible cost per unit of commodity or service.
- For whom to produce?(a) For whom to produce refers to a problem in which decision regarding which category of people are going to consume a good, i.e., economically poor or rich.(b) As we know, goods and services are produced for those who can purchase them or have the capacity to buy them.(c) Capacity to buy depends upon how income is distributed among the factors of production. The higher the income, the higher will be the capacity to buy and vice versa. So, this is a problem of distribution.(d) The guiding principle is that the economy must see here that important and urgent wants of its citizens are being satisfied for the maximum possible extent or not.
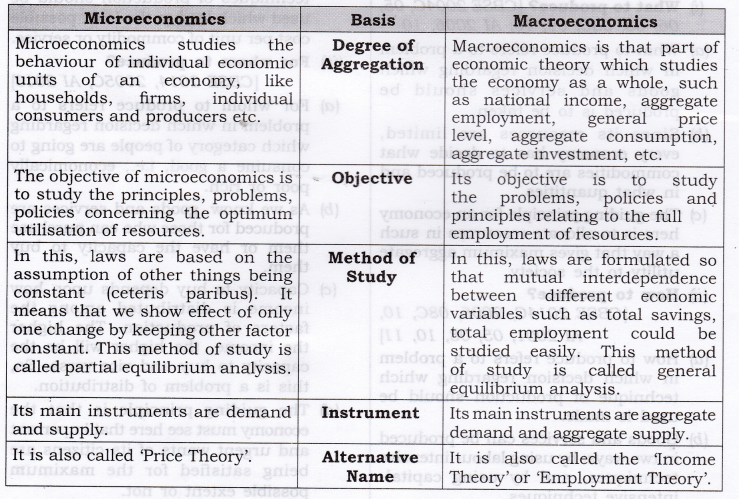
- The subject matter of economics includes microeconomics and macroeconomics.
- Microeconomics, studies the behaviour of individual economic units of an economy, like households, firms, individual consumers and producers etc. It does not study the economy as a whole.
- Macroeconomics is the part of economic theory that studies the economy as a whole, such as national income, aggregate employment, general price level, aggregate consumption, aggregate investment, etc.
MORE QUESTIONS SOLVED
- Resources are limited.
- They have alternative uses.
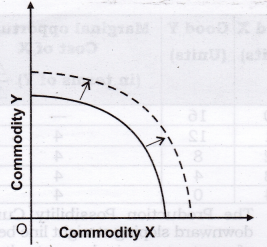
- Supply of skilled labour (like IT engineers) has increased in India causing a rightward shift in the production of IT software.
- Discovery of oil reserves in the gulf countries has caused a substantial shift to the right in the PPC of these countries.
- Related to less developed countries: Labour is underutilised as indicated by mass unemployment in countries like India.
- Related to developed countries: Capital is underutilised during depression when production is decreased owing to lack of demand.
- Individual demand;
- Individual supply; and
- Individual income.
- Aggregate demand;
- Aggregate supply; and
- National income.
- What to produce and in what quantity?
- How to Produce?
- Wants are unlimited:(a)This is a basic fact of human life. Human wants are unlimited.(b)They are not only unlimited but also grow and multiply very fast.
- Resources are limited:(a)The resources to produce goods and services to satisfy human wants are available in limited quantities. Land, labour, capital and entrepreneurship are the basic scarce resources.(b)These resources are available in limited quantities in every economy, big or small, developed or underdeveloped, rich or poor. Some economies may have more of one or two resources but not all the resources.(c)For example, Indian economy has relatively more labour but less capital and land. The U.S. economy has relatively more land but less labour. No economy in the world is comfortable in all the resources.
- Resources have alternative uses:(a)Generally a resource has many alternative uses.(b)A worker can be employed in a factoiy, in a school, in a government office, self employed and so on.(c) Like this, nearly all resources have alternative uses. But the problem is that which resource should be put to which use.
Question 2. Give reasons for the following statements:
- Every economy has to make the decision relating to what to produce.
- Problem of choice arises because available resources have alternative uses.
Answer:
- As, we know there is no economy in this world which possesses infinite resources to produce each and everything in infinite quantities.Therefore, if an economy decides to produce a quantity of one commodity, then they have to sacrifice the production of another commodity.
- Resources in eveiy economy are always scarce. But the available resources can be put to alternative uses. Therefore, an economy will always prefer to make use of its resources in production of those goods and services that are most required and sacrifice the production of less- required goods and services.
- What to produce and in what quantity?
- How to produce?
- For whom to produce?
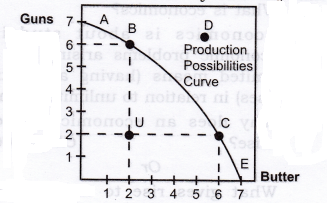
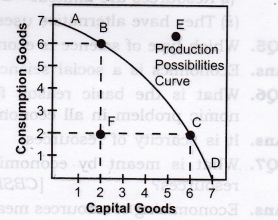
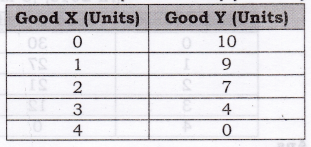
- PPC is downward sloping: The downward slope of PPC means if the country wants to produce more of one good, it has to produce less quantity of the other goods.
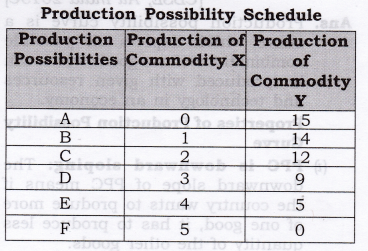
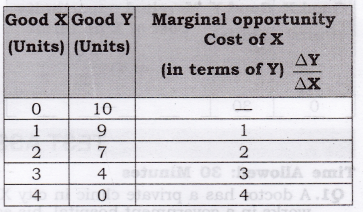
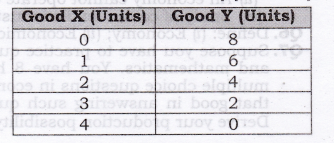
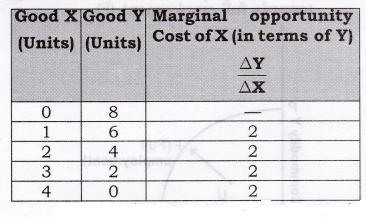
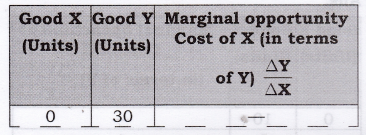
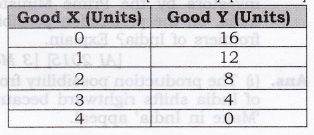
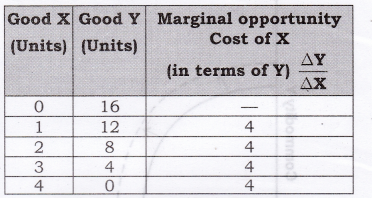
- PPC is concave to the point of origin: Concave shape of PPC implies that the slope of PPC increases. Slope of PPC is defined as the quantity of goods Y given up in exchange for additional unit of goods X.[Slope of Production Possibility Curve]=ΔYΔX=AmountofGoodYlostAmountofGoodXgained[Slope of PPC] = MRT = [Marginal Opportunity Cost]
- First, the amount of resources in the economy is fixed.
- Second, the technology is given and unchanged.
- Third, the resources are efficient and fully employed.Using the figure given below answer the following (Q.9 & Q.10).
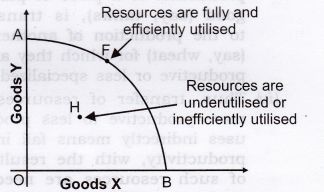
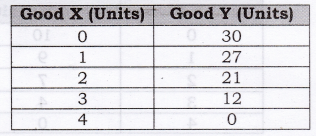
- PPC is concave because of increasing marginal opportunity cost (MOC).
- This behavior of the MOC is based on the assumption that all resources are not equally efficient in production of all goods.
- Rise in opportunity cost occurs when factors (resources) which are specialized or more adopted for production of a piece of particular good (say, tanks), is transferred to the production of another good (say, wheat) for which they are less productive or less specialized.
- Thus, transfer of resources from more productive to less productive uses indirectly means fall in their productivity, with the result more of such resources are needed to produce an additional unit of the other commodity. Thus marginal opportunity cost goes on increasing making the PP curve concave in shape.
Question 10. Give reasons for the following statements:
- A Production Possibility Frontier is always a downward sloping concave curve.
- An efficient economy would always produce a combination of goodsthat lies on the given Production Possibility Frontier.
- Growth of an economy is represented in the form of a rightward shift of a Production Possibility Frontier.
Answer:
- A PPF slopes downward to indicate if an economy chooses to produce more of one commodity, then it would have to reduce the production of another commodity.The concave shape of PPF is due to Increase in Marginal Opportunity Cost.
- Any point on a given PPF presents a production possibility wherein all the available resources in an economy get fully utilized.Any combination located below the given PPF shows an under utilization of available resources. Likewise, any point to the right of the PPF is beyond the available resources.
- By economic growth, we mean that an economy has developed greater capacity to produce larger quantity of goods by acquiring more resources. Graphically, this would be represented by a rightward shift of PPF.
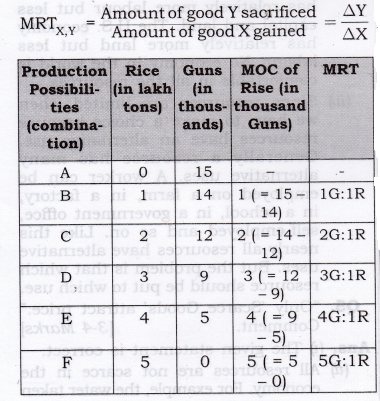
- Marginal opportunity cost is an addition to a cost in terms of a number of units of a commodity sacrificed to produce one additional unit of another commodity.
- Marginal opportunity cost can also be termed marginal rate of transformation, Marginal rate of transformation is the ratio of number of units of a good sacrificed to produce one additional unit of another commodity.
- We defend this statement because scarcity arises as resources are limited. The resources to produce goods and services to satisfy human wants are available in limited quantities. Land, labour, capital and entrepreneurship are the basic scarce resources.
- These resources are available in limited quantities in eveiy economy, big or small, developed or underdeveloped, rich or poor. Some economies may have more of one or two resources but not all resources.
- For example, the Indian economy has relatively more labour but less capital and land. The U.S. economy has relatively more land but less labour. No economy in the world is comfortable in all the resources.
- Since resources are limited, then we have to make a choice because resources have an alternative use. Generally a resource has many alternative uses. A worker can be employed on a farm, in a factory, in a school, in a government office, self-employed and so on. Like this nearly all resources have alternative uses. But the problem is that which resource should be put to which use.
- The given statement is correct.
- All resources are not scarce in the economy. For example, the water takenfrom river or air we breathe is abundant in relation to wants. Such goods are available free of cost. These goods are known as Non-Economic Goods.
- On the other hand, some goods are scarce in relation to their wants. For example, diamonds, petrol, electricity, etc. are scarce in relation to wants. These goods command price and are known as Economic Goods.
- Rainwater should be conserved by rain water harvesting.
- Water wastage should be avoided i.e., economical use of water.
Value: Awareness about efficient use of water.
Question 15 There are various sources of income a teacher has; such as,
- He can earn Rs 40000 from teaching in school.
- He can earn Rs 50000 by tuition/ coaching
- He earns Rs 60000 by writing the help book guides.What is the opportunity cost of his teaching in school? Why should he choose teaching profession? [1 Mark]
Answer: Opportunity cost of teaching is the writing of books. He should choose teaching profession because it provides maximum social welfare. Value: Social welfare
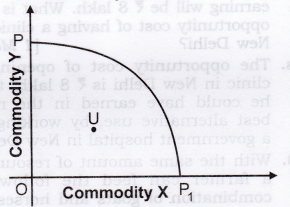

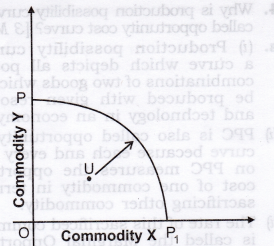
- Production possibility curve is a curve which depicts all possible combinations of two goods which can be produced with given resources and technology in an economy.
- PPC is also called opportunity cost curve because each and every point on PPC measures the opportunity cost of one commodity in terms of sacrificing other commodity.
- The rate of this sacrificed commodity is called the Marginal Opportunity Cost of the expanding good.
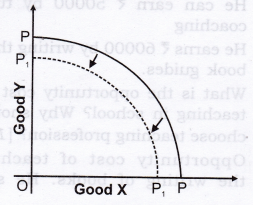
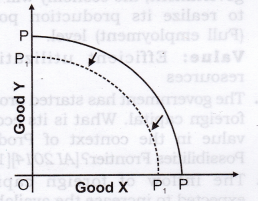
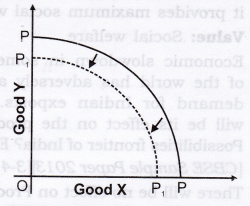
- The Production Possibility Curve shifts to the left.
- It is so because outflow of foreign capital decreases the capital resource in our country leads to fall in production capacity of our country.
- It can be explained with the help of the diagram that PP is at full employment level and due to outflow of foreign capital it shifts leftwards P1P1.
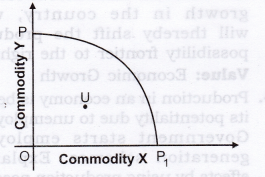
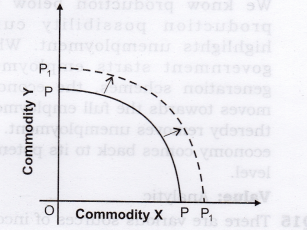
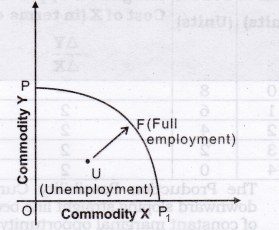
- The economy moves towards the full employment, thereby removes unemployment.
- This can be done when government starts employment generation schemes. By this, economy moves towards full employment and production potentiality of an economy increases.
- It can be explained with the help of the following diagram. In the given figure,from unemployment (U), we are moving towards full employment (F).

Chapter-2 Consumer Equilibrium
Question 1. What do you mean by the budget set of a consumer?
Or
Define Budget Set.
Answer: Budget set is the collection of all bundles of goods that a consumer can buy with his income at the prevailing market prices.
Question 2. What is Budget Line?
Answer: Budget line is a graphical representation which shows all the possible combinations of the two goods that a consumer can buy with the given income and prices of commodities. It is also called consumption possibility line.
Question 3. Explain why budget line is downward sloping?
Or
Why is budget line negatively sloped? [CBSE 2011 C][l Mark]
Answer: ‘Budget line is downward sloping because if a consumer wants to buy more of one commodity, he has to buy less of other goods, given money income.
Question 4. A consumer wants to consume two goods. The prices of the two goods are Rs 4 and Rs 5 respectively. The consumer’s income is Rs 20.
- Write down the equation of the budget line.
- How much quantify of good 1 can the consumer consume if she spends her entire income on that good?
- How much of good 2 can she consume if she spends her entire income on that good?
- What is the slope of the budget line? [3-4 Marks]
Answer:
- Let the two quantities of goods be X and Y. We are given Px = Rs 4, P = Rs 5, Consumer’s income (M) = Rs 20. Budget line equation is,
Px .X + Py .Y = M or = 4X + 5Y = 20 - If quantity consumed of good Y = 0, Budget equation becomes,
Px.X + zero = M = 4.X = 20 = X = 20/4 = 5 units - If quantity consumed of good X = 0, Budget equation becomes,
Zero + Py.Y = M
or = 5Y = 20 = Y = 20/5 = 4 units. - Slope of budget line = Px/Py = 4/5 = 0.8
Questions 5, 6 and 7 are related to question 4,
Question 5. How does the budget line change if the consumer’s income increases to ?40 but the prices remain unchanged? [1 Mark]
Answer: If consumer’s income increases to Rs 40, the consumer can buy more pieces/quantities of both the goods X and Y. There will be parallel rightward shift in the budget line AB to A1B1.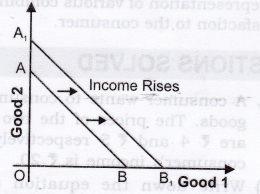
Question 6. How does the budget line change if the price of good 2 decreases by a rupee but the price of good 1 and the consumer’s income remain unchanged? [ 1 Mark]
Answer: If price of good 2 (shown on y-axis) decreases, consumer can buy more pieces /quantity of good 2. The budget line AB will pivot at B and rotate upwards to A1 B.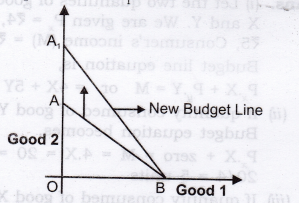
Question 7. What happens to the budget set if both the prices as well as the income double? [ 1 Mark]
Answer: There will be no change in the budget line. Let us understand this with the help of an example: Suppose,the price of goods 1 rises from Rs 4 to Rs 8 and that of goods 2 rises from Rs 5 to Rs 10. Income also rises from Rs 20 to Rs 40. With double increase in prices and income, intercepts on both X-axis and Y-axis will remain unchanged at 5 units (goods 1) and 4 units (goods 2) respectively. Slope of budget line will also remain the same. Therefore, there will be no change in the budget set and the budget line.
Question 8. Suppose a consumer can afford to buy 6 units of good 1 and 8 units of good 2 if she spends her entire income. The prices of the two goods are Rs 6 and Rs 8 respectively. How much is the consumer’s income? [1 Mark]
Answer: Budget equation is given as: Px.X + Py .Y = M
Let good 1 be X and good 2 be Y Putting the values, we get,
(6).(6) + (8).(8) = 36 + 64 = Rs 100
Question 9. Suppose a consumer wants to consume two goods which are available only in integer units. The two goods are equally priced at Rs 10 and the consumer’s income is Rs 40.
- Write down all the bundles that are available to the consumer.
- Among the bundles that are available to the consumer’s. Identify those which cost her exactly 40.[3-4 Marks]
Answer: Let Px = Py = Rs 10
Money Income = 40
- Bundles available to consumer are: (0,0), (0,1), (0,2), (0,3), (0,4), (1,0), (1,1), (1,2), (1,3), (2,0), (2,1), (2,2), (3,0), (3,1) and (4, 0).
- (0,4), (1,3), (2,2), (3,1) and (4,0) cost exactly Rs 40. All the other bundles cost less than Rs 40.
Question 10. What are monotonic preferences? [AI 2011 C][l Mark]
Answer: Consumer’s preferences are assumed to be such that between any two bundles (x1, x2) and (y1, y2), if (x1, x2) has more of at least one of the good and no less of the other good as compared to (y1, y2), the consumer prefers (x1, x2) to (y1, y2). Preferences of this kind are called monotonic preferences.
Question 11. If a consumer has monotonic preferences, can she be indifferent between the bundles (10, 8) and (8, 6)? [1 Mark]
Answer: No, if a consumer has monotonic preferences, bundle (10, 8) is preferred to bundle (8, 6) as bundle (10, 8) has more units of both the goods.
Question 12. Suppose a consumer’s preferences are monotonic. What can you say about her preference ranking over the bundles (10, 10), (10, 9), (9, 9). [1 Mark]
Answer: If a consumer has monotonic preferences then,
- Bundle (10, 10) is monotonically preferred to bundle (10, 9) and bundle (9, 9).
- Bundle (10, 9) is monotonically preferred to bundle (9, 9).
Question 13. Suppose your friend is indifferent to the bundles (5, 6) and (6, 6). Are the preferences of your friend monotonic? [I Mark]
Answer: No, the preferences of my friend are not monotonic since bundle (6, 6) should be monotonically preferred to bundle (5, 6).
MORE QUESTIONS SOLVED
I. Very Short Answer Type Questions (1 Mark)
Question 1. Define utility. [CBSE 2005C, 06C, AI 06]
Answer: Utility is the power or capacity of a commodity to satisfy human wants.
Question 2. Define total utility.
Answer: Total utility is the sum of all the utilities derived from consumption of all the units of a particular commodity.
Question 3. How much is total utility at zero level of consumption?
Answer: Zero.
Question 4. How is total utility deriveds from marginal utility?
Answer: TU = MU1 + MU2 + MU3 +————- +
Question 5. Define marginal utility. [AI 2006, Foreign 2006]
Answer: Marginal utility is the additional utility derived from consumption of an additional unit of a commodity.
Question 6. What is consumer’s equilibrium? [Foreign 2006, CBSE 2009C, AI 2013C]
Answer: Consumer’s equilibrium refers to a situation where a consumer gets the maximum satisfaction out of his given money income and given market price.
Question 7. What is meant by MU of one rupee?
Answer: MU of one rupee refers to the utility obtained from purchase of commodities with one rupee.
Question 8. Define indifference curve. [AI 2013, 2014, 2015]
Answer: Indifference curve refers to the graphical representation of various combinations of the two goods that provide the same level of satisfaction to a consumer.
Question 9. Define indifference map? [CBSE 2013C, AI 2015]
Answer: A set of indifference curves is called indifference map.
Question 10. Define marginal rate of substitution.
Answer: MRS is the rate at which a consumer is willing to give up one commodity for an extra unit of other commodity without affecting his total satisfaction.
Question 11. Why are indifference curves always convex to the origin?
Answer: Indifference curves are always convex to the origin because of the diminishing marginal rate of substitution.
Question 12. Why does an indifference curve slope downwards?
Answer: An Indifference curve slopes downwards because increase in units of one good requires decrease in the number of units of the other good to maintain the same level of satisfaction.
Question 13. Give equation of Budget Line. [CBSE 2015]
Answer: P1X1 + P2X2 = M.
Question 14. Give equation of Budget Set. [CBSE 2015]
Answer: P1X1 + P2X2 < M.
Question 15. Define Budget Set. [CBSE 2015]
Answer: It is the collection of all bundles of pieces of goods that a consumer can buy with his income at the prevailing market prices.
Question 16. Define Budget Line. [AI 2015]
Answer: Budget line is a graphical representation which shows all the possible combinations of the two goods that a consumer can buy with the given income and prices of commodities.
II. Multiple Choice Questions (1 Mark)
Question 1. Total utility is maximum when
(a) Marginal utility is zero.
(b) Marginal utility is at its highest point.
(c) Marginal utility is equal to average utility.
(d) Average utility is maximum.
Answer: (a)
Question 2. Which of the shaded area in the diagrams below represent total utility? [CBSE Sample Paper 2014]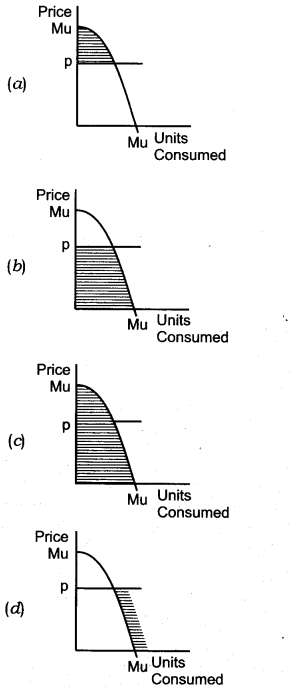
Answer: (c)
Question 3. What does the area under the marginal utility curve depict? [CBSE Sample Paper 2014]
(a) Average Utility
(b) Total Utility
(c) Indifference Curve
(d) Consumer Equilibrium
Answer: (b)
Question 4. Which one of the following is not an assumption of the theory of demand based on analysis of indifference curve?
(a) Given scale of preferences as between different combinations of two goods.
(b) Diminishing marginal rate of substitution.
(c) Constant marginal utility of money.
(d) Consumers would always prefer more of a particular piece of goods to less of it, other things remaining the same.
Answer: (c)
Question 5. The consumer is in equilibrium at a point where the budget line—
(a) Is above an indifference curve.
(b) Is below an indifference curve.
(c) Is tangent to an indifference curve.
(d) Cuts an indifference curve.
Answer: (c)
Question 6. An indifference curve slopes down towards right since more of one commodity and less of another result in—
(a) Same satisfaction.
(b) Greater satisfaction.
(c) Maximum satisfaction.
(d) Decreasing expenditure.
Answer: (a)
Question 7. The second glass of lemonade gives lesser satisfaction to a thirsty boy. This is a clear case of
(a) Law of demand.
(b) Law of diminishing returns.
(c) Law of diminishing utility.
(d) Law of supply.
Answer: (c)
Question 8. The consumer is in equilibrium when the following condition is satisfied:
(a)
(b)
(c)
(d)None of these.
Answer: (c)
Question 9. Which of the following options is a property of an indifference curve?
(a) It is convex to the origin.
(b) The marginal rate of substitution is constant as you move along an indifference curve.
(c) Marginal utility is constant as you move along an indifference curve.
(d) Total utility is the greatest where the 45 degrees line cuts the indifference curve.
Answer: (a)
Question 10. When economists speak of the utility of a certain good, they are referring to-
(a) The demand for the good.
(b) The usefulness of the good in consumption.
(c) The satisfaction gained from consuming the good.
(d) The rate at which consumers are willing to exchange one unit of good for an other one.
Answer: (c)
Question 11. Budget set is—
(a) Right angled triangle formed by the budget line with the axes.
(b) All points on the budget line.
(c) Points inside the budget line.
(d) Points on Y-axis from where budget line starts and the point on X-axis where budget line ends.
Answer: (a)
Question 12. If indifference curve is straight line downward sloping,
(a) MRS is increasing
(b) MRS is decreasing
(c) MRS is constant
(d) MRS is zero
Answer: (c)
Question 13. If X and Y are two commodities, indifference curve shows—
(a) X and Y are equally preferred
(b) Y is preferred to X
(c) X is preferred to Y
(d) None of these.
Answer: (a)
Question 14. If Marginal Rate of Substitution is constant throughout, the Indifference curve will be: [CBSE 2015]
(a) Parallel to the x-axis.
(b) Downward sloping concave.
(c) Downward sloping convex.
(d) Downward sloping straight line.
Answer: (d)
Question 15. If Marginal Rate of Substitution
is increasing throughout, the Indifference curve will be: [AI 2015]
(a) Downward sloping convex.
(b) Downward’ sloping concave.
(c) Downward sloping straight line.
(d) Upward sloping convex.
Answer:(b)
Question 16. Which of the can be referred to as ‘point of satiety’?
(a) Marginal Utility is negative
(b) Marginal utility is zero
(c) Total Utility is rising
(d) Total Utility is falling
[CBSE Sample Paper 2016]
Answer: (b)
III. Short Answer Type Questions (3-4 Marks)
Note: Questions 1, 2 and 3 have same figure.
Question 1. Explain with diagram, the relationship between TU and MU. [CBSE Foreign 2011]
Answer: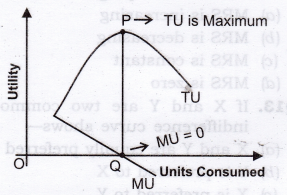
- When MU decreases, TU increases at a diminishing rate. (As shown in figure till consumption level OQ).
- When MU is zero, TU is constant and maximum at P.
- When MU is negative, TU starts diminishing.
Question 2. How many chocolates will a consumer have, if they are available free of cost?
Answer: In case of free chocolates, consumer will carry on the consumption till his total utility is maximum. It means,till the additional chocolates gives positive satisfaction, consumer will keep on having chocolates. Let us understand this with the help of the figure shown in Question 1. Consumer will stop the consumption at the point of satiety (Point ‘Q’), i.e., where marginal utility is equal to zero.
Question 3. “Total Utility remains the same, whether Marginal Utility is positive or negative”. Defend or refute.
Answer: The given statement is refuted. When Marginal Utility is positive till point Q as shown in figure of Question 1, then total Utility increases at a diminishing rate and when Marginal Utility is negative after point Q, total Utility decreases.
Question 4. State with reasons if the following statements are true or false:
- At a grand family get-together party you go on eating and eating since you have not to pay.
- As we consume more units of a commodity, our total utility from its consumption keeps falling.
Answer:
- False: For free goods, a consumer will limit his consumption of a commodity to a point where the point of full satisfaction is reached. Consumption beyond this point will only generate disutility.
- False: As we consume more units of a commodity, it’s marginal utility keeps on diminishing. Total utility keeps on rising, but at a diminishing rate till marginal utility becomes zero.
Question 5. Explain the law of diminishing marginal utility with the help of a total utility schedule. [CBSE 2005C, 06C, 10, IOC, AI 2006, CBSE 13]
Answer: The law states that marginal utility derived from the consumption of a commodity declines as more units of that commodity are consumed.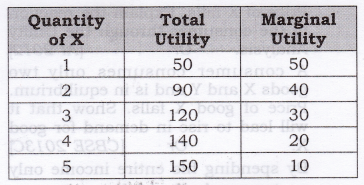
It can be seen from the above schedule that total utility increases at a diminishing rate, which leads to fall in marginal utility.
Question 6. Derive MU Schedule from TU Schedule.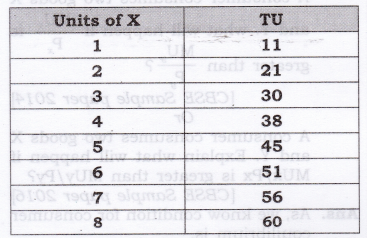
Answer: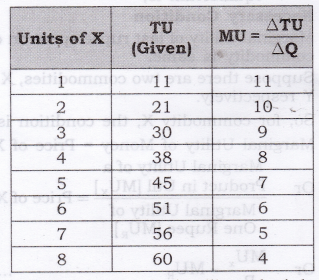
Question 7. A person’s marginal utility schedule is given below. Derive their total utility schedule.
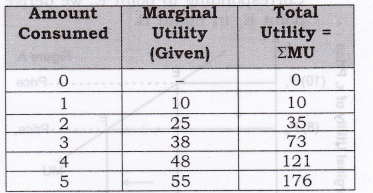
Answer:
As we know total utility is the sum total of marginal utilities as shown below.
Question 8. Calculate: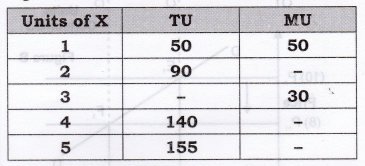
Answer: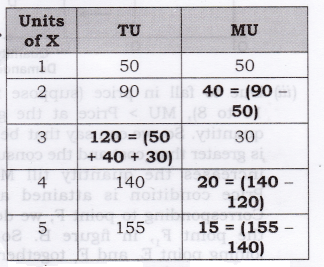
Question 9. Derive the inverse relation between price of the good and its demand from single commodity equilibrium condition “marginal utility = price”. [CBSE Foreign 2011]
Answer: As we know a consumer purchases a good up to the point where marginal utility of the good becomes equal to the price of that good.
MU = Price
- Figure B is derived from Figure A.
- In figure A, initially, consumer equilibrium is attained at point E, where let MU (10) = Price (10). Corresponding to point E, we derive point E1 in figure B.
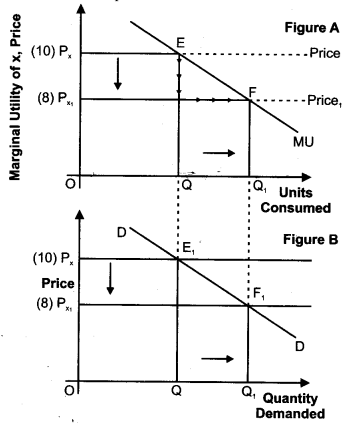
- Due to fall in price (suppose from 10 to 8), MU > Price at the given quantity. So, we can say that benefit is greater than cost and the consumer increases the quantity till MU = Price condition is attained at F. Corresponding to point F, we derive the point F1; in figure B. So, by joining point E1 and F1 together, we derive the demand curve.
Question 10. A consumer consumes only two goods X and Y. At a consumption level of these two goods, he finds that the ratio of marginal utility to price in case of X is higher than that in case of Y. Explain the reaction of the consumer. [AI 2011]
Or
A consumer consumes only two goods X and Y and is in equilibrium.
Price of X falls. Explain the reaction of the consumer through the Utility Analysis. Or [AI 2012]
A consumer consumes only two goods X and Y and is in equilibrium. Price of good X falls. Show that it will lead to rise in demand for good X. Or [CBSE 2013C]
By spending his entire income only on two goods X and Y a consumer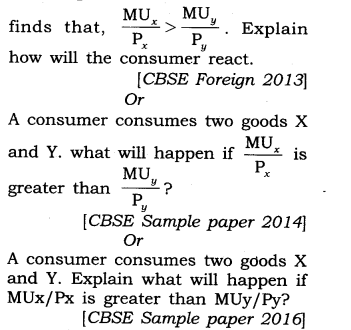
Answer: As, we know condition for consumer equilibrium is,
Necessary Condition
Marginal utility of last rupee spent on each commodity is same.
Suppose there are two commodities, X and Y respectively.
So, for commodity X, the condition is, Marginal Utility of Money = Price of X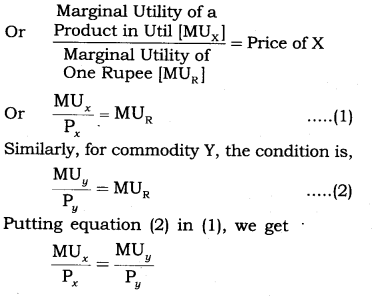
But as given in the question that the ratio of marginal utility to price in case of X is higher than that in case of Y,i.e….
It means marginal utility from the last rupee spent on commodity X is more than marginal utility from the last rupee spent on commodity Y. So, to attain the equilibrium consumer must increase the quantity of X, which decreases the MUx and decreases the quantity of Y, which will increase the MUy. Increase in quantity of X and decrease in quantity of Y till
Question 11. A consumer consumes only two goods X and Y. At a certain consumption level of these goods, he finds that the ratio of marginal utility to price in case of X is lower than that in case of Y. Explain the reaction of the consumer. Or [AI2011]
By spending his entire income only on two goods X and Y a consumer finds that,
Or
[CBSE Foreign 2013]
A consumer consumes only two goods X and Y and is in equilibrium. Show that when the price of good X rises, the consumer buys less of good X. Use utility analysis. [AI 2014]
Answer: As, we know condition for consumer equilibrium is, Necessary Condition
Marginal utility of last rupee spend on each commodity is same.
Suppose there are two commodities, X and Y respectively.
So, for commodity X, the condition is, Marginal Utility of Money = Price of X
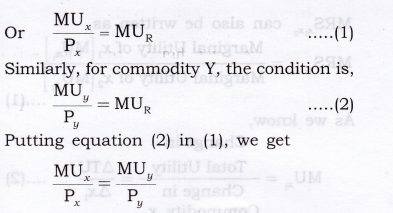
But as given in the question that the ratio of marginal utility to price in case of X is lower than that in case of Y, i.e.,
It means, marginal utility from the last rupee spent on commodity X is less than the marginal utility from the last rupee spent on commodity Y. So, to attain the equilibrium the consumer must decrease the quantity of X which will increase the MUx and increase the quantity of Y, which will decrease the MU . Decrease in quantity of X and increase in quantity of Y continue till
Question 12. Explain the meaning of diminishing marginal rate of substitution with the help of a numerical example. [AI 2013]
Answer: MRS is the rate at which a consumer is willing to sacrifice one commodity for an extra unit of another commodity without affecting his total satisfaction.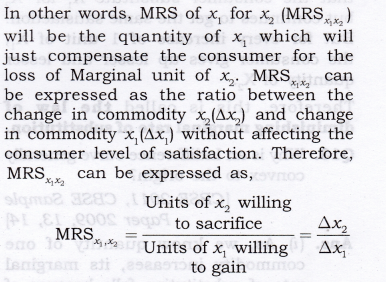
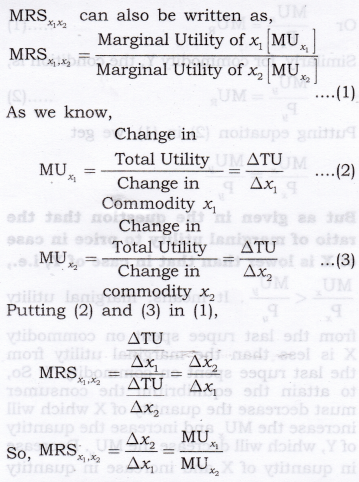
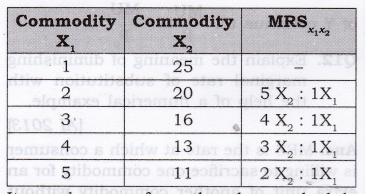
It can be seen from the above schedule that the consumer substitute X1 for X2 but continues to get the same satisfaction. But for every increase of 1 unit of X1; the consumer gives up lesser and lesser quantity of X2.
Therefore, this is called the law of diminishing marginal rate of substitution.
Question 13. Why is an Indifference curve generally , convex to the origin? [CBSE 2011, CBSE Sample Paper 2009, 13, 14]
Answer:
- As, we know quantity of one commodity increases, its marginal rate of substitution falls because of law of diminishing marginal utility. Marginal rate of substitution is a slope of Indifference curve and whenever slope [MRS] decreases it makes the curve convex to the point of origin.
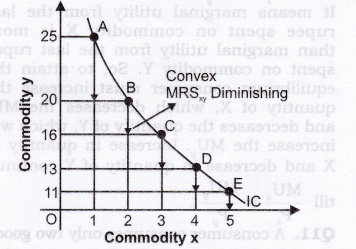
- In the above diagram, units of y are measured on vertical axis and units of x on horizontal axis. When the consumer moves from combination A (1 x + 25y) to B (2x + 20y), he acquires one additional unit of x and forgoes (sacrifice) 5 units of y, if he wants to get the same level of satisfaction. The consumer has to reduce the consumption of y when he increases the consumption of x. The number of units of good y that the consumer is willing to sacrifice for an additional unit of good x, so as to maintain the same level of satisfaction is technically called the marginal rate of substitution of x for y and is denoted by MRSxy .
- So, the MRSxy when the consumer move from combination A to B is 5 : 1, further as the consumer move from combination B to C, he acquires one more units of x, but the consumer forgoes a smaller number of y, i.e., MRSxy at this stage is 4 : 1. It may be observed now that MRS diminishes as the consumer moves from combination A to B, B to C, C to D, D to E. The consumer forgoes less and less units of y as he acquires additional unit of x.
Question 14. Explain why an Indifference curve has a negative slope (i.e. IC slope down-wards to the right). [CBSE 2011]
Answer: Every IC is based on the assumption that various combinations of two commodities gives equal satisfaction to a consumer. In order to remain at the same level of satisfaction, the consumer will have to reduce the consumption of one commodity if he wants to increase the consumption of another commodity.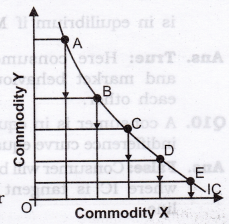
Question 15. Why do Indifference curves not intersect each other?
Answer:
- Two IC’s cannot intersect each other. This property is proved by Contradict Method. First we assume that they intersect each other and then show that this assumption leads to an absurd conclusion. Let us assume that IC1 intersects IC2 at point E shown in the figure given here.
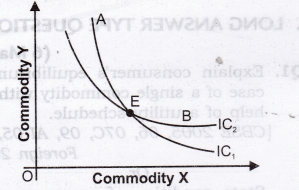
- Let point A be a point on IC, and point B on IC2. Since A and E lie on IC,, the consumer will be indifferent between points E and A (A = E). Similarly, B and E lie on IC2, the consumer will be indifferent between points E and B (B = E).
- Based on the assumption of transitivity as A = E and B = E, then the consumer must be indifferent between A and B (A = B) but this is not possible as A and B lie on two different ICs and represent different levels of satisfaction. Therefore, IC cannot intersect each other.
Question 16. Explain that Higher IC provides higher level of satisfaction, or
‘Higher indifference curve represents higher level of satisfaction to the consumer’. Explain the statement, also state the underlying assumption related to this property of indifference curve. [CBSE Sample Paper 2016]
Answer:
- Higher IC lying above and to the right of another IC represents a higher level of satisfaction. All combinations of goods X and Y lying on the higher indifference curve IC2 have more satisfaction than lower indifference curve IC1 as shown in figure given here.
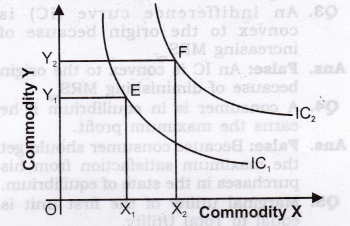
- This is because of monotonic preferences, as monotonic preferences state that we must have atleast more of one good and no less that of other goods (means other goods can be equal or greater, but not less). The figure above shows that bundle F(OX2 + OY2) is monotonic preferred to bundle E(OX1 + OY1). So, if bundle F is monotonic preferred to bundle E than F bundle gives more satisfaction than that of Bundle E.
- It can be seen from the above diagram that all combinations of IC2 contain a large quantity of both X and Y, than all combinations on IC,. For, e.g., point E lying on IC, represents OX, units of X and OY1 units of Y. Point F lying on IC2 represents more units of Y, i.e., OY, as well as more units of X, i.e. OX2.
The consumer gets greater satisfaction from a larger pieces of goods than from a smaller amount. Hence, point F shall be on a higher IC and shall be more preferable to point E, lying on lower IC.
IV.True Or False
Giving reasons, state whether the following statements are true or false.
Question 1. Total utility increases as long as marginal utility is positive (+).
Answer: True: Because TU is the sum of marginal utilities and MU is positive.
Question 2. TU starts declining when MU starts declining.
Answer: False: Because TU starts declining only when diminishing MU becomes negative.
Question 3. An indifference curve (IC) is convex to the origin because of increasing MRSxy.
Answer: False: An IC is convex to the origin because of diminishing MRS .
Question 4. A consumer is in equilibrium if he earns the maximum profit.
Answer: False: Because consumer should get the maximum satisfaction from his purchases in the state of equilibrium.
Question 5. Marginal utility of the first unit is equal to Total Utility.
Answer: True: MU = TUn – TUn-1 = TU1 – TU0= TU1
Question 6. In case of single commodity, consumer will be in equilibrium when M.U. = Income.
Answer: False: A consumer is in equilibrium when MU = Price.
Question 7. If there are two commodities, consumer is in equilibrium if
Answer: False: A consumer is in equilibrium only when
Question 8. If TU remains the same; MU may be negative or positive.
Answer: False: TU decreases if MU is negative, ‘ and TU increases if MU is positive.
It is constant and maximum only if MU = 0.
Question 9. In case of indifference curve consumer is in equilibrium if
Answer: True: Here consumer’s behaviour and market behaviour match with each other.
Question 10. A consumer is in equilibrium where indifference curve equals budget line?
Answer: False: Consumer will be in equilibrium where IC is tangent to the budget line.
Question 11. All points on the budget line give equal satisfaction to the consumer.
Answer: False: All points on an IC give equal satisfaction.
Question 12. All combinations on an IC are achievable by a consumer.
Answer: False: All the combinations on a budget line are achievable and not points on IC.
Note: As per CBSE guidelines, no marks will be given if reason to the answer is not explained.
V. Long Answer Type Questions (6 Marks)
Question 1. Explain consumer’s equilibrium in case of a single commodity with the help of a utility schedule. [CBSE 2005, 06, 07C, 09, AI 05, 08,Foreign 2009] Or
State condition of consumer equilibrium in case of a single commodity. Or [CBSE 2006]
There is given the market price of a piece of goods, how does a consumer decides as to how many units of that piece of goods to buy. [AI 2008, 09] Or
How many units of a commodity should a consumer buy to get its maximum utility? Explain with the help of a numerical example. [Foreign 2005]
Or
There is given the price of a good, how does a consumer decide as to how much quantity of that goods to buy? [CBSE 2012)
Answer:
- When purchasing a unit of a commodity a consumer compares its price with the expected utility from it. Utility obtained is the benefit, and the price payable is the cost. The consumer compares benefit and the cost. He will buy the unit of a commodity only if the benefit is greater than or at least equal to the cost.
- Equilibrium Conditions for Single Commodity Consumer Equilibrium.
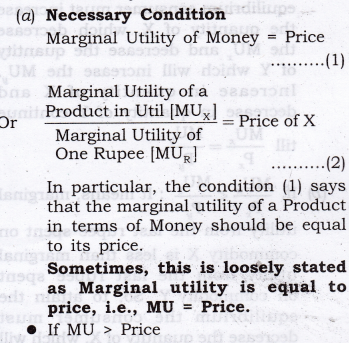
> As a rational consumer he will continue to purchase an additional unit of a commodity as long as MU = Price.
> MU > Price implies benefit is greater than cost and whenever benefit is greater than cost, the consumer keeps on consuming additional unit of a commodity till MU = Price.
> It is so because according to the law of diminishing marginal utility MU falls as more is purchased. As MU falls it is bound to become equal to the price at some point of purchase.
• If MU< Price
> As a rational consumer he will have to reduce the consumption of a commodity as long as MU = Price.
> MU < Price implies when benefit is less than cost, and whenever benefit is less than cost the consumer keeps on decreasing the additional unit of a commodity till MU = Price.
> It is so because according to the law of diminishing marginal utility, MU rises as less units are consumed. As MU rises, it is bound to become equal to the price at some point of purchase.
(b) Sufficient Condition: Total gain falls as more is purchased after equilibrium. It means that consumer continues to purchase so long as total gain is increasing or at least constant. - It can be explained with the help of the following schedule:
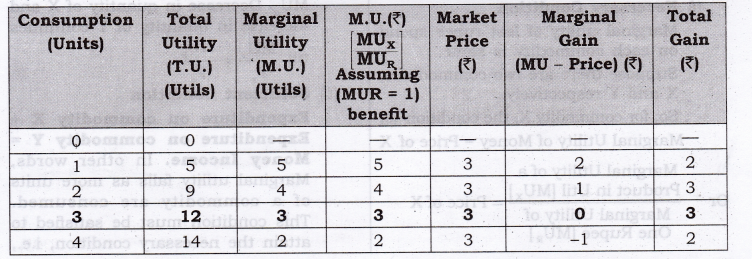
(a) Suppose, the price of commodity X in the market is Rs3 per unit. It means he has to pay ?3 per unit for all the units he buys. Suppose, the utility obtained from the first unit is 5 utils (= Rs5). The consumer will buy this unit because the utility of this unit is greater than the price and this process continues till Marginal utility = Price as shown in the above schedule at quantity 3.
(b) Consumer will not buy the fourth unit because utility of this unit is 2 units (= Rs2) which is less than the price. It is not worth buying the fourth unit. The consumer will restrict his purchase to only 3 units.
Question 2. A consumer consumes only two goods. Explain the conditions of the consumer’s equilibrium with the help of Utility Analysis.
[CBSE Sample Paper 2013] Or
State and explain the condition of consumer’s equilibrium in case of two commodities through utility approach.[CBSE 2009C, Foreign 2005, 2010]
Answer: According to the two commodity consumer equilibrium or law of Equimarginal utility, a consumer gets maximum satisfaction, when ratios of MU of two commodities and their respective prices are equal. Conditions of Consumer’s Equilibrium in case of two commodities
- Necessary Condition
Marginal utility of last rupee spend on each commodity is same. Suppose there are two commodities, X and Y respectively.
So, for commodity X, the condition is, Marginal Utility of Money = Price of X
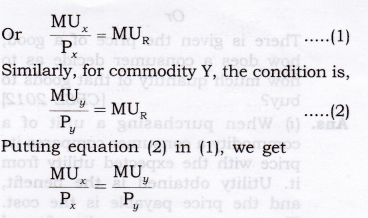
(a) IfMUxPx>MUyPy : It means, marginal utility from the last rupee spent on commodity X is more than marginal utility from the last rupee spent on commodity Y. So, to attain the equilibrium consumer must increase the quantity of X, which decrease the MUx and decrease the quantity of Y which will increase the MUy .Increase in quantity of X and decrease in quantity of Y continue tillMUxPx=MUyPy
(b) If,MUxPx<MUyPy
It means, marginal utility from the last rupee spent on commodity X is less than marginal utility from the last rupee spent on commodity Y. So, to attain the equilibrium the consumer must decrease the quantity of X, which will increase the MUx and increase the quantity of Y, which will decrease the MUy. Decrease in quantity of X and increase in quantity of Y continues tillMUxPx=MUyPy - Sufficient Condition
Expenditure on commodity X + Expenditure on commodity Y = Money Income. In other words, Marginal utility falls as more units of a commodity are consumed. This condition must be satisfied to attain the necessary condition, i.e.,MUxPx=MUyPy .If MU does not fail as consumption of a commodity increases, the consumer will spend all his income on one commodity, which is highly unrealistic.
Question 3. For a consumer to be in equilibrium why must marginal rate of substitution be equal to the ratio of prices of the two goods? [CBSE Sample Paper 2009] Or
Using indifference curve approach, explain the conditions of consumer’s equilibrium. [CBSE 2010, IOC, 11C, Foreign 2010, AI 11]
Or
Why is the consumer in equilibrium when he buys only that combination of the two goods that is shown at the point of tangency of the budget line with an indifference curve? Explain. [CBSE Sample Paper 2009] Or
What are the conditions of consumer’s equilibrium under the indifference curve approach? What changes will take place if the conditions are not fulfilled to reach equilibrium? Or [Al 2010]
State and explain the conditions of consumer’s equilibrium in indifference curve analysis. [CBSE 2013, C]
Or
Explain consumer equilibrium using the concept of budget line and indifference map or Interior Optimum Consumer Equilibrium.
Or
A consumer consumes only two of goods. For the consumer to be in equilibrium why must Marginal Rate of Substitution between the two goods must be equal to the ratio of prices of these two goods? Is it enough to ensure equilibrium?
[CBSE Sample Paper 2013] Or
A consumer consumes only two goods. Explain the conditions that need to be satisfied for the consumer to be in equilibrium under indifference curve analysis. [CBSE Sample Paper 2014] Or
Show diagrammatically the conditions for consumer’s equilibrium, in Hicksian analysis of demand. [CBSE Sample Paper 2016]
Answer: (i) To define consumer equilibrium, we use Indifference Curve map and the budget line.
Two Conditions for Consumer Equilibrium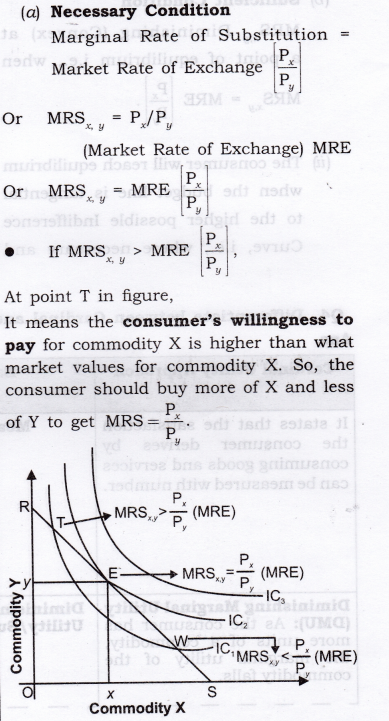
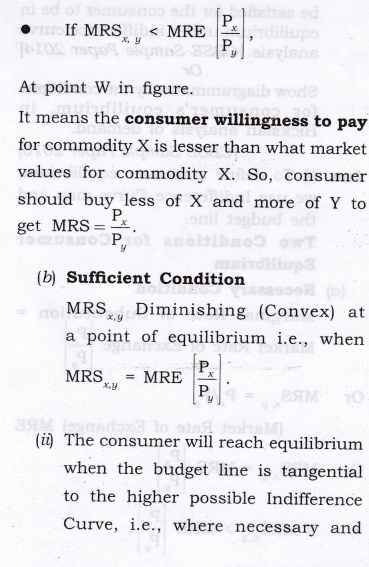
sufficient conditions satisfy. In the above diagram, the consumer will reach equilibrium at point E where budget line RS is tangential to the highest possible IC2.
(iii) The consumer cannot move to Indifference Curve, i.e., IC3 as this is beyond his money income.
(iv) Even on IC2, all the other points except E are beyond his means.
(v) Hence, at point E, the consumer is in equilibrium where his satisfaction maximizes, given his income and prices of goods X and Y. In equilibrium at E, the slope of Budget line = the slope of Indifference Curve. Therefore, MRSxy is equal to the ratio of the prices of two goods
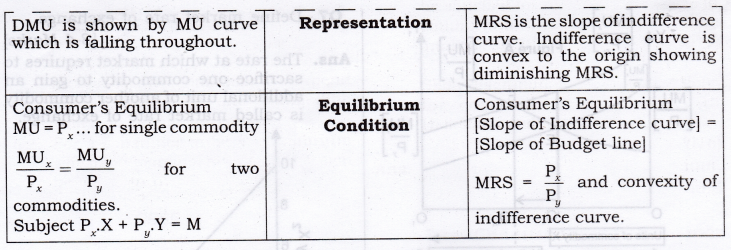
Question 4. Differentiate between Cardinal and Ordinal Utility. [AI 2012]
Answer: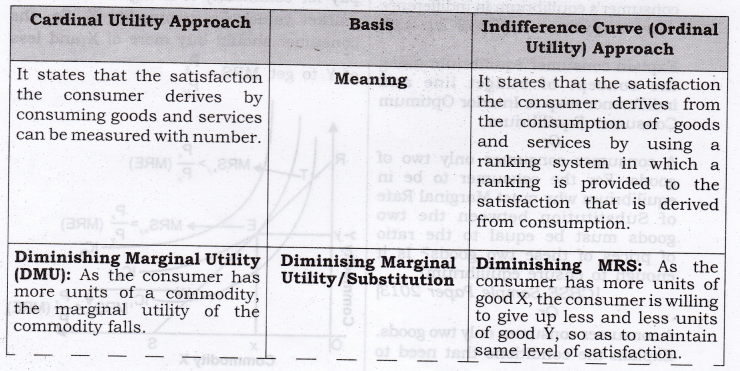
VI. Higher Order Thinking Skills (Hots)
Question 1. What does budget line in terms of price and money income indicate? [1 Mark]
Answer: Budget line in terms of prices and money income indicate that prices are implicitly in the budget line.
Question 2. What is the slope of budget line? [1 Mark]
Answer: The slope of budget line
Question 3. What is the horizontal (X-axis) intercept of budget line? [J Mark]
Answer: Horizontal intercept of budget line
Question 4. What is the Vertical (Y-axis) intercept of budget line?
Answer. Vertical intercept of budget line
Question 5. “Law of diminishing marginal utility will operate even if consumption takes place in intervals.” Defend or refute. [3-4 Marks]
Answer: The given statement is refuted. Law of diminishing marginal utility will operate only when consumption is a continuous process. For example, if one sandwich is consumed in the morning and another in the afternoon, the second sandwich may provide equal or higher satisfaction as compared to the first one.
Question 6. Derive the law of demand from the two commodity equilibrium condition “Marginal Utility = price ratio through utility approach”. [3-4 Marks]
Answer:
- The law states that a consumer is in equilibrium when the ratio of MU to price in case of each good consumed is the same. In of goods, X and Y, a consumer is in equilibrium when,
MUxPx=MUyPy . - Given that the consumer is in equilibrium and price of X falls. It can be seen from the figures that Figure B is derived from Figure A.
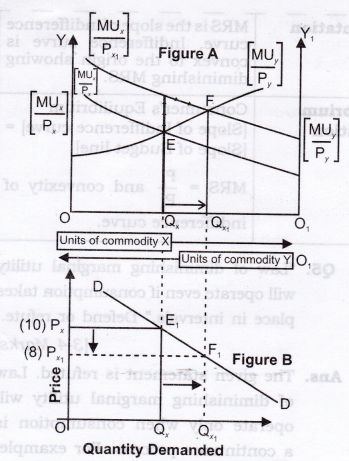
- In figure A, initially, the consumer equilibrium is attained at point E,where
MUxPx=MUyPy (Assuming, Px =10). Corresponding to point E, we derive point E1 in figure B. - Due to fall in price (suppose from 10 to 8),
MUxPx>MUyPy ,at the given quantity Qx. It means, marginal utility from the last rupee spent on commodity X is more than marginal utility from the last rupee spent on commodity Y. So, to attain the equilibrium the consumer must increase the quantity of X, which decreases the MUx and decreases the quantity of Y, which will increase the MUy. Increase in quantity of X and decrease in quantity of Y continueMUxPx=MUyPy and the new consumer equilibrium will be attained at point F. Corresponding to point F, we derive the point F1, in figure B. So, by joining point E1 and F1, we derive the demand curve.
Question 7. Define market rate of exchange. [3-4 Marks]
Answer: The rate at which market requires to sacrifice one commodity to gain an additional unit of another commodity is called market rate of exchange.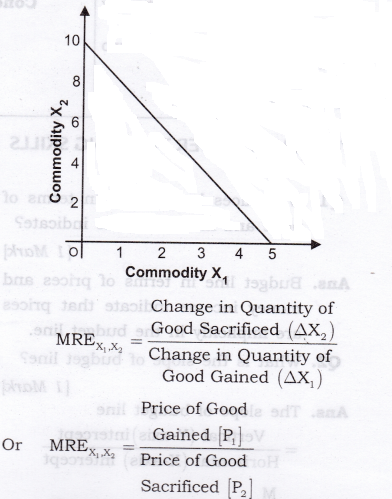
VII. Value Based Questions
Question 1. How is the law of diminishing marginal utility applied with regard to education/ knowledge? [1 Mark]
Answer: In this case the law of diminishing marginal utility will not apply because every effort to get education/ knowledge increases the utility. Value: Analytic
VIII. Application Based Questions
Question 1. A consumer has Rs 10, and both goods X and Y are priced at Rs 2 and are available in integer units, (a) give the bundles that this consumer can afford to buy (bj give the bundles that cost exactly Rs 10 (c) give two bundles that this consumer cannot afford to buy. [3-4 Marks]
Answer: (a) The bundles that this consumer can afford to buy,
(0,0), (0,1), (0,2), (0,3), (0,4), (0,5),
(1.0), (1,1), (1,2), (1,3), (1,4), (2,0),
(2.1), (2,2), (2,3), (3,0), (3,1), (3,2), (4,0), (4,1) and (5,0).
(b) Bundles that cost exactly ?10 are, (0,5), (1,4), (2,3), (3,2), (4,1), (5,0).
(c) Two bundles that the consumer cannot afford to buy are, (3, 3), (4, 2).
Question 2. A consumer has Rs 40 and both goods X and Y are priced at Rs 20 and are available in integer units, (a) Give the bundles that this consumer can afford (b) give the bundles that cost exactly Rs 40. [3-4 Marks]
Answer: (a) Affordable bundles are, (0,0), (0,1),(0,2),(1,0),(1,1),(2,0).
(b) Bundles that cost exactly Rs 40 are, (0, 2), (1, 1), (2, 0).
Question 3. Give reasons for the following statements: [3-4 Marks]
- If the income of a consumer changes and prices of the two goods remain unchanged, a new budget line will be formed which will be parallel to the original line.
- If the income of the consumer remains unchanged and if the price of goods X rises, intercept of the budget line of Y-axis will remain the same, but on the X-axis it will shift to the left.
Answer:
- As we know, slope of budget line is Px (i.e. price ratio of two goods) with the increase in income. remains constant and only ability to purchase quantities of both commodity X and commodity Y increases. Hence, the budget line shift parallel to the right because when slope is same, than curve should be parallel.
- In this case, the price ratio between X and Y changes. Since the price of X rises, the consumer is in a position to purchase lesser quantity of X while his ability to purchase Y remains unchanged.
Question 4. Giving reasons, comment on the following statements: [3-4 Marks]
- A consumer’s equilibrium is always formed at a point on the given budget line.
- A consumer’s equilibrium will shift to a higher indifference curve with an increase in consumer’s income.
Answer:
- Budget line shows all possible combinations of the two goods that a consumer can buy, given income and prices of commodities. Any other combination lying to the right of this line will be unreachable. Any combination lying to the left of this line results in non-spending of his income.
- Higher income means an increase in a consumer’s ability to purchase increased quantity of both the goods, represented by a rightward shift of the budget line. The new budget line will form a tangent to a higher indifference curve.
Question 5. Giving reasons, state why the following two conditions must be satisfied when a consumer is in equilibrium. [3-4 Marks]
- A budget line must be tangent to an indifference curve.
- Marginal rate of substitution must be diminishing.
Answer:
- Only when the budget line is tangent to an indifference curve, it indicates the highest level of satisfaction that a consumer can attain given his money income and the prices of two commodities.
- Diminishing marginal rate of substitution ensures that the indifference curve is convex to the origin. Only then the point of tangency becomes the point of consumer’s equilibrium.
Class 12 Micro Economics Chapter-4 Elasticity of Demand
Question 1. Explain price elasticity of demand.
Answer: The degree of responsiveness of quantity demanded to changes in price of commodity is known as price elasticity of demand.
Question 2. Consider the demand for a good. At price Rs 4, the demand for the good is 25 units. Suppose price of the good increases to Rs 5, and as a result, the demand for the good falls to 20 units. Calculate the price elasticity? [3-4 Marks]
Answer: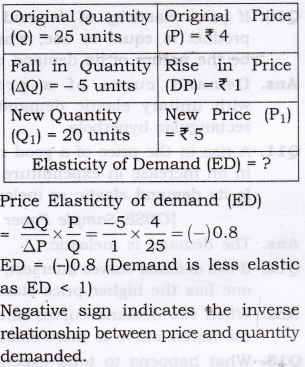

Answer:
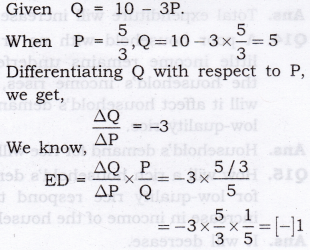
Negative Sign of ED indicates that inverse relationship between price and quantity demanded.
PED = 1 [Unitary elastic demand].
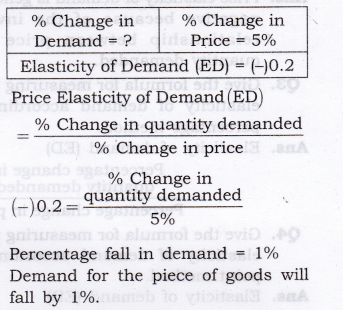
Question 4. Suppose the price elasticity of demand for a good is -0.2. If there is a 5% increase in the price of the good, by what percentage will the demand for the good go down?[3-4 Marks]
Answer:
Question 5. Suppose the price elasticity of demand for a good is -0.2. How will the expenditure on the good be affected if there is a 10% increase in the price of the good? [1 Mark]
Answer: Total expenditure will rise if there is 10% rise in the price of the good since its demand is inelastic (Given ED = 0.2).
Question 6. Suppose, there was 4% decrease in the price of a good and as a result, the expenditure on the goods increased by 2%. What can you say about the elasticity of demand? [1 Mark]
Answer: As total expenditure has increased with a decrease in price, the demand is said to be highly elastic.
MORE QUESTIONS SOLVED
I. Very Short Answer Type Questions (1 Mark)
Question 1. Define price elasticity of demand.
Answer: The degree of responsiveness of quantity demanded to changes in price of the commodity is known as price elasticity of demand.
Question 2. Why is price elasticity of demand has negative sign always?
Answer: Price elasticity of demand is generally negative because of the inverse relationship between price and quantity demanded.
Question 3. Give the formula for measuring price elasticity of demand according to percentage method.
Answer: Elasticity of demand (ED)
Percentage change in quantity demanded Percentage change in price
Question 4. Give the formula for measuring price elasticity of demand according to point method.
Answer: Elasticity of demand (ED)
Lower Segment of demand curve (LS)
Upper Segment of demand curve (US)
Question 5. Define perfectly inelastic demand.
Answer: If price changes, and quantity demand remains constant, ed = 0 and the result is known as perfectly inelastic demand.
Question 6. Define perfectly elastic demand.
Answer: If quantity demand changes and price remains constant, ed = o and the result is known as perfectly elastic demand.
Question 7. Demand for product X is perfectly ! elastic. What will be the change in price if demand rises from 50 per unit to 70 per unit?
Answer: There will be no change in price as demand is perfectly elastic.
Question 8. If ED < 1, in which portion the point would be located on a straight line demand curve?
Answer: In the lower half.
Question 9. When is the demand of a commodity said to be inelastic? [CBSE Sample Paper 2010]
Answer: When percentage change in the quantity demanded is less than percentage change in price, demand for such a commodity is said to be less elastic.
Question 10. If price elasticity of demand for a product is equal to one, what will be the nature of its demand curve?
Answer: Demand curve of a product with unitary elastic demand is a rectangular hyperbola.
Question 11. A rise in the price of a good results in an increase in expenditure on it. Is its demand elastic or inelastic? [CBSE Sample Paper 2008}
Answer: The demand is inelastic.
Question 12. If two demand curves intersect, which one has the higher price elasticity?
Answer: When two demand curves intersect, the flatter curve is more elastic.
Question 13. What happens to total expenditure on a commodity when its price falls and its demand is price elastic? [CBSE Sample Paper 2010}
Answer: Total expenditure will increase.
Question 14. A poor household with no or very little income remains underfed. If the household’s income rises, how will it affect household’s demand for low-quality rice.
Answer: Household’s demand for rice will rise.
Question 15. How will a rich household’s demand for low-quality rice respond to an increase in income of the household?
Answer: It will decrease
Multiple Choice Questions (1 Mark)
Question 1. In case of a straight-line demand curve meeting the two axes, the price- elasticity of demand at the midpoint of the line would be:
(a) 0 (b) 1 (c) 1.5 (d) 2
Answer: (b)
Question 2. Identify the factor which generally keeps the price elasticity of demand for a good low:
(a) Variety of uses for that good.
(b) Its low price.
(c) Close substitutes for that good.
(d) High proportion of the consumer’s income spent on it.
Answer: (b)
Question 3. Identify the coefficient of price elasticity of demand when the percentage increase in the quantity of good demanded is smaller than the percentage fall in its price:
(a) Equal to one.
(b) Greater than one.
(c) Smaller than one. (d) Zero.
Answer: (c)
Question 4. If the demand for a good is inelastic, an increase in its price will cause the total expenditure of the consumers of the good to:
(a) remain the same, (b) increase.
(c) decrease. (d) Any of these.
Answer: (b)
Question 5. Which one of the following four possibilities, results in an increase in total consumer expenditure?
(a) Demand is unitary elastic and price falls.
(b) Demand is elastic and price rises.
(c) Demand is inelastic and price falls.
(d) Demand is inelastic and price rises.
Answer: (d)
Question 6. The price elasticity of demand for hamburger is:
(a) the change in the quantity demanded of hamburger when the hamburger increases by 30 paise per rupee.
(b) the percentage increase in the quantity demanded of hamburger when the price of hamburger falls by 1 per cent per rupee.
(c) the increase in the demand for hamburger when the price of hamburger falls by 10 per cent per rupee.
(d) the decrease in the quantity demanded of hamburger when the price of hamburger falls by 1 per cent per rupee.
Answer: (b)
Question 7. The price elasticity of demand is defined as the responsiveness of:
(a) price to a change in quantity demanded.
(b) quantity demanded to a change in price.
(c) price to a change in income.
(d) quantity demanded to a change in income.
Answer: (b)
Question 8. A decrease in price will result in an increase in total revenue if:
(a) the percentage change in quantity demanded is less than the percentage change in price.
(b) the percentage change in quantity demanded is greater than the percentage change in price.
(c) demand is inelastic.
(d) the consumer is operating along a linear demand curve at a point at which the price is very low and the quantity demanded is very high.
Answer: (b)
Question 9. An increase in price will result in an increase in total revenue if:
(a) The percentage change in quantity demanded is less than the percentage change in price.
(b) The percentage change in quantity demanded is greater than the percentage change in price.
(c) Demand is elastic.
(d) The consumer is operating along a linear demand curve at a point at which the price is very high and the quantity demanded is very low.
Answer: (a)
III. Short Answer Type Questions
Question 1. Differentiate between perfectly elastic and perfectly inelastic demand. [3-4 Marks]
Answer: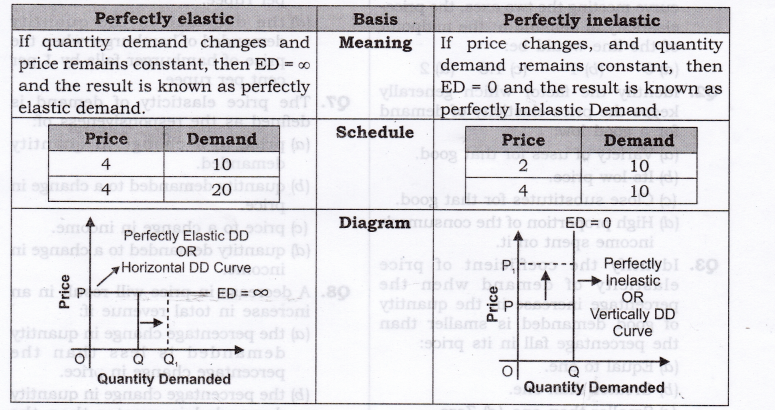
Numerical Problems on Price Elasticity of Demand to Calculate PED
Question 2. When price is Rs. 20 per unit, demand for a commodity is 500 units. As the price falls to Rs. 15 per unit, demand expands to 800 units. Calculate elasticity of demand.
Answer: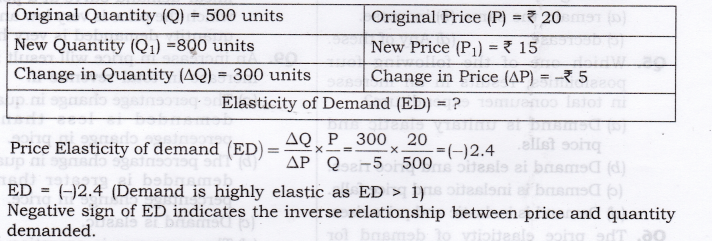
Question 3. The demand for a goods falls to 500 units in response to rise in price by Rs. 10. If the original demand was 600 units at the price of Rs. 30, calculate price elasticity of demand.
Answer:

Question 4. A consumer spends Rs. 80 on a commodity when price is Rs. 1 per unit. If the price increases by Rs. 1, his expenditure becomes Rs. 96. Comment on PED.
Answer: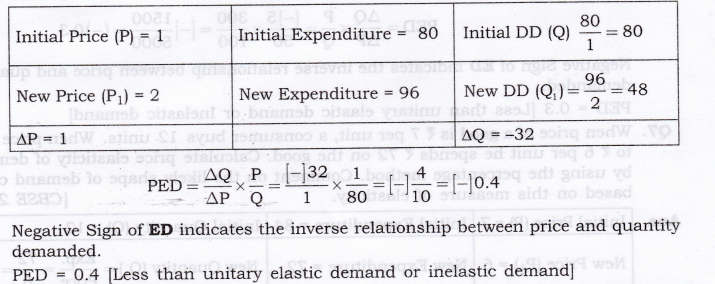
Question 5. A decline in the price of good X by Rs. 5 causes an increase in its demand by 20 units to 50 units. The new price is X 15. Calculate elasticity of demand.
Answer: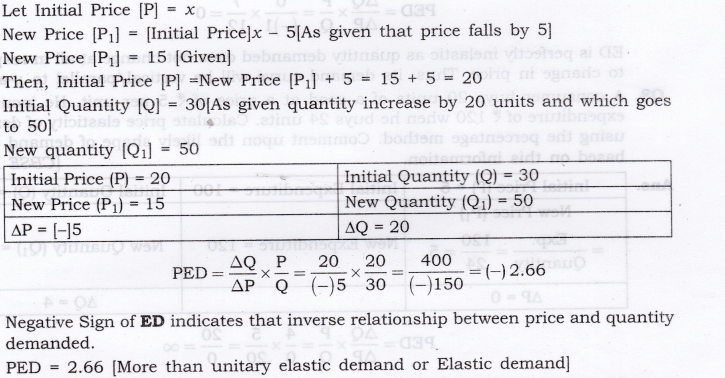
Question 6. A dentist was charging Rs. 300 for a standard cleaning job, and per month it used to generate total revenue equal to Rs. 30,000. She has increased the price of dental cleaning to Rs. 350 since last month. As the result of, few customers are now coming for dental clearing, but the total revenue is now Rs. 33,250. From this, what can we conclude about the elasticity of demand for such a dental service. Calculate PED by proportionate method.
Answer: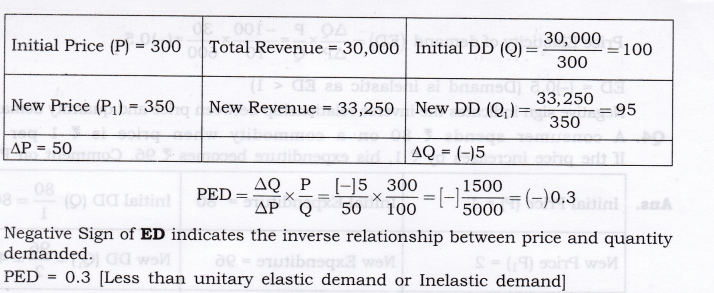
Question 7. Negative Sign of ED indicates the inverse relationship between price and quantity demanded. PED = 0.3 [Less than unitary elastic demand or Inelastic demand]
When price of a good is Rs. 7 per unit, a consumer buys 12 units. When price falls to Rs. 6 per unit he spends Rs. 72 on the good. Calculate price elasticity of demand by using the percentage method. Comment on the likely shape of demand curve based on this measure of elasticity. [CBSE 2012]
Answer:
ED is perfectly inelastic as quantity demanded does not change at all in response to change in price. Thus, its demand curve will be vertical/parallel to y-axis.
Question 8. A consumer buys 20 units of a good at a price of Rs. 5 per unit. He incurs an expenditure of Rs. 120 when he buys 24 units. Calculate price elasticity of demand using the percentage method. Comment upon the likely shape of demand curve based on this information. [CBSE 2012]
Answer:
ED is perfectly elastic as price does not change at all in response to change in quantity demanded. Thus, its demand curve will be horizontal/parallel to x-axis.
Question 9. A consumer buys 10 units of a commodity at a price of Rs. 10 per unit. He incurs an expenditure of Rs. 200 on buying 20 units. Calculate price elasticity of demand by the percentage method. Comment upon the shape of demand curve based on this information. [AI 2012]
Answer:
Question 10. ED is perfectly inelastic as quantity demanded does not change at all in response to change in price. Thus, its demand curve will be vertical/parallel to y-axis. A consumer spends Rs.1000 on a good priced at Rs.10 per unit. When its price falls by 20 per cent, the consumer spends Rs.800 on the good. Calculate the price elasticity of demand by the Percentage method. [AI 2015]
Answer:
ED is perfectly inelastic as quantity demanded does not change at all in response to change in price. Thus, its demand curve will be vertical/parallel to y-axis.
Numerical Problems to Calculate Price or Quantity (When Price Elasticity of Demand is given)
Question 11. A consumer demands 40 kg of a commodity when its price is Rs. 1 per kg. If the price increases by Rs. 0.10, what would be the quantity demanded? PED = -1.
Answer:
As, price is increasing, then quantity demanded must decrease by 4.
So, New Quantity = Initial quantity + AQ = 40 + (-4) = 36
Question 12. PED = [-] 1. A consumer demands 50 units of a commodity when price is Rs 1 per unit. At what price will he demands 45 kg of a commodity?
Answer: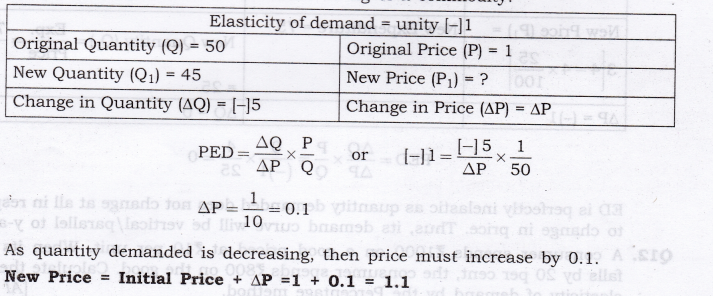
Question 13. A consumer spends Rs. 80 on a commodity when price is Rs 1 per unit. If the price increases by ?1, what would be his expenditure. PED = -0.4?
Answer: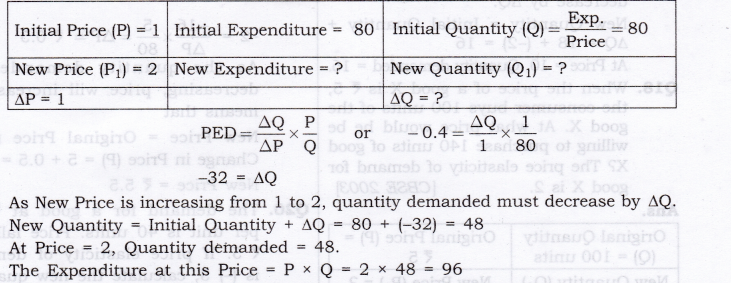
Question 14. The market demand for a good at Rs. 5 per unit is 50 units. Due to increase in price, the market demand falls to 30 units. Find out the new price if the price elasticity of demand is (-)2.
Answer: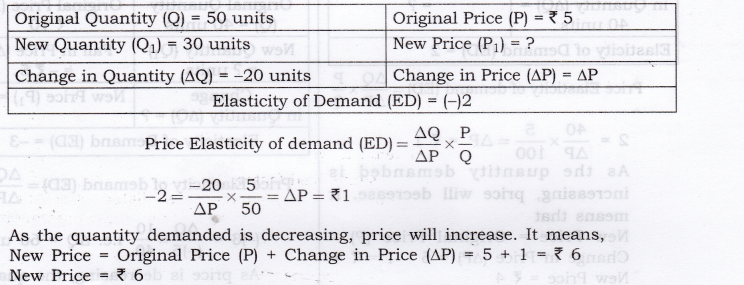
As the quantity demanded is decreasing, price will increase. It means,
New Price = Original Price (P) + Change in Price (AP) = 5 + 1 = Rs. 6 New Price = Rs. 6 v
Question 15. A consumer buys 18 units of a good at a price of Rs 9 per unit. The price elasticity of demand for the good is (-)l. How many units the consumer will buy at a price of Rs 10 per unit? Calculate. [CBSE 2014]
Answer: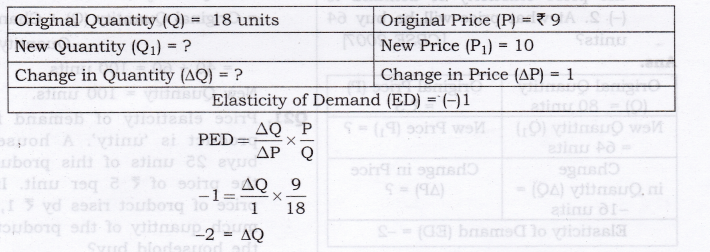
Class 12 Micro Economics Chapter-5 Production
Question 1. Explain the concept of a production function. [CBSE 2004C, 07, 09C; AI 05, 08, 11] [1 Mark]
Answer: The relationship between physical input and physical output of a firm is generally referred to as production function.
The general form of production
function is, q = f (x1 : x2)
where, q = output, x1 = 1 input like labour, x2 = another input like machinery
Question 2. What is the total product of an input? [ 1 Mark]
Answer: Total product of an input refers to total volume of goods and services produced by a firm with the given inputs during a specified period of time.
Question 3. What is the average product of an input? [AI 2013,Q] [1 Mark]
Answer: Average Product of am input is per unit product of variable factors. It is calculated by dividing the total Product by the units of variable factor.
Average Product =
Question 4. ‘What is the marginal product of an input? [AI 2005, 13C; 07; CBSE 2005, 06, 06C] [1 Mark]
Answer: Marginal Product of an input is an addition to the total product when an additional unit of a variable factor is employed.
Question 5. Explain the relationship between the marginal products and the total product of an input.
Or [AI 05, 07; CBSE 05, 06, 07] Explain the law of variable proportion with the help of total product and marginal product curves.
[CBSE 2010, 2013] Or
Explain the likely behaviour of Total Product and Marginal Product when for increasing production only one input is increased while all other inputs are kept constant.
[CBSE Sample Paper 2010] [6 Marks] Or
State the different phases of changes in Total Product and Marginal Product in the Law of Variable Proportions. Also show the same in a single diagram. [CBSE 2015]
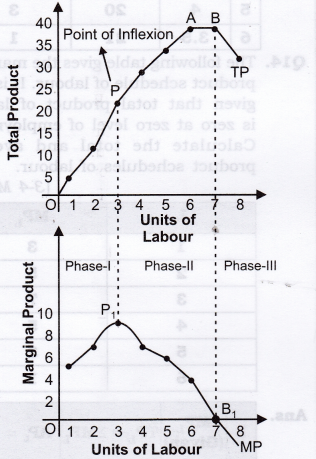
Answer: According to the Law of Variable Proportion when only one input is increased while all other inputs are kept constant, Marginal Product and Total Product behave in the following manner:
- When Marginal product rises (till Point P1), Total product increases at an increasing rate (convex shape) (till point P).
- When Marginal product falls and remains positive (Till point B1), total product increases at a diminishing rate (concave shape) (till point A),
- When Marginal Product is zero (at point B1), Total Product is at its maximum and constant (At point B),
- When Marginal product becomes negative (after point B1), total product falls (after point B).
Question 6. Explain the concepts of the short run and the long run. [3-4 Marks]
Answer:
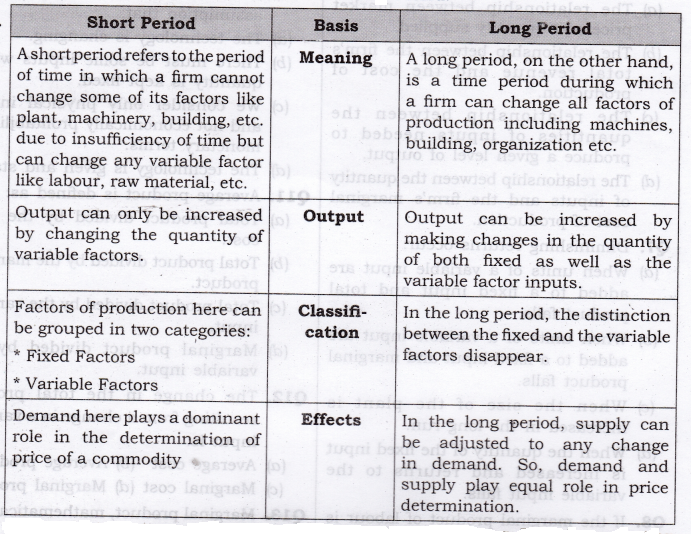
- Short run:
(a) A short run refers to the period of time in which a firm cannot change some of its factors like plant, machinery, building, etc. due to insufficiency of time but can change any variable factor like labour, raw material, etc.
(b) Thus, in short run, there will be some factors of production that are fixed at predetermined levels, e.g., a farmer may have fixed amount of land, - Long run:
(a) A long run is a time period during which a firm can change all its factors of production including machines, building, organization, etc.
(b) In other words, it is a period of time during which supplies can adjust itself to change in demand.
Note:
(i) Mind, here the terms long run and short run are functional and do not refer to a calendar month or a year,
(ii) This distinction depends merely upon how quickly factor inputs can be change by producers in an industry.
Question 7. What is the law of diminishing marginal product? [I Mark]
Answer: The Law of diminishing marginal product states that when we applied more and more units of variable factor to a given quantity of fixed factor, total product increases at a diminishing rate and marginal product falls.
Question 8. What is the law of variable proportions?
Or
Define the law of variable proportion. [CBSE 2004, 06[[1 Mark]
Answer: The law of variable proportion states that as we increase the quantity of only one input, keeping other inputs fixed, the total product increases at an increasing rate in the beginning, then increases at decreasing rate and after a level the output ultimately falls.
Question 9. The following table gives the total product schedule of labour. Find the corresponding average product and marginal product schedules of labour. [3-4 Marks]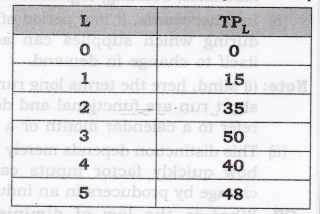
Answer: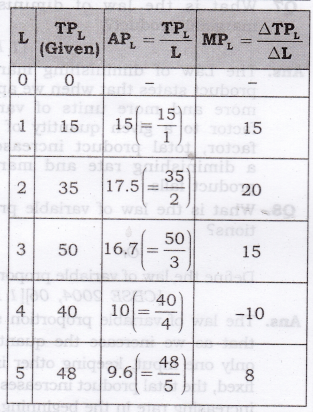
Question 10. The following table gives the average product schedule of labour. Find the total product and marginal product schedules. It is given that the total product is zero at zero level of labour employment. [3-4 Marks]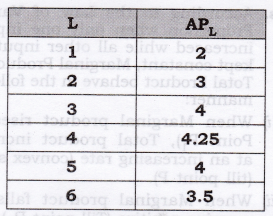
Answer: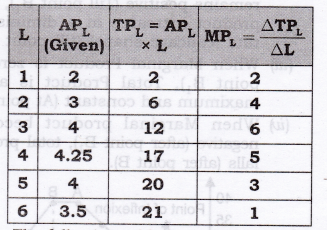
Question 11. The following table gives the marginal product schedule of labour. It is also given that total product of labour is zero at zero level of employment. Calculate the total and average product schedules of labour. [3-4 Marks]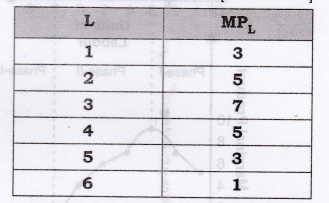
Answer: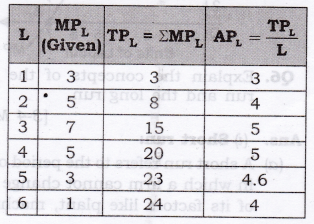
Question 12. Let the production function of a firm be
Answer:
Q = 5 x 10 x 10 = 500 units So, the maximum possible output(Q) = 500 units.
MORE QUESTIONS SOLVED
I. Very Short Answer Type Questions (1 Mark)
Question 1. Give the meaning of production function. [CBSE 2007, AI 2011] Or
Define production function. [CBSE Sample Paper 2008]
Answer: The relationship between physical input and physical output of a firm is generally referred to as production function.
Question 2. In which run some factors of production are fixed and others are variable?
Answer: Short run.
Question 3. What change will take place in marginal product when total product increases at a diminishing rate? [CBSE Sample Paper 2010]
Answer: Marginal product will decline but remains positive.
Question 4. In which phase of Law of Variable Proportions a rational firm aims to operate?
Answer: Diminishing returns to a factor (Phase 2).
Question 5. What is meant by diminishing returns to a factor?
Answer: Diminishing returns to a factor refer to a phase when total product increases at a decreasing rate and marginal product falls, but remains positive with the increase in variable factor.
Question 6. What is the general shape of the AP and MP curves?
Answer: AP and MP curves are inversely U-shaped.
Question 7. How does fall in marginal production affect total output?
Answer: Fall in marginal product affects the total output in the following two manners:
- When marginal product falls, but remains positive, total product increases at a diminishing rate.
- When marginal product falls and become zero, total product falls in its absolute terms.
Question 8. Why MP curve cuts AP curve at its maximum point?
Answer: It happens because when AP rises, MP is more than AP. When AP falls, MP is less than AP. So, it is only when AP is constant and at its maximum point that MP is equal to AP. Therefore, MP curve cuts AP curve at its maximum point.
Question 9. Can AP rise when MP starts declining?
Answer: Yes, AP can rise when MP starts declining. It can happen as long as falling MP is more than AP. However, when MP becomes equal to AP, further decline in MP will also reduce AP.
Question 10. What is the shape of AP and MP?
Answer: Inverse U-Shaped.
Question 11. Give meaning of “Return to a Factor”. [CBSE 2013Q]
Answer: Return to a factor states that change in the physical output of a good when only the quantity of one input is increased, while that of other input is kept constant.
II. Multiple Choice Questions (1 Mark)
Question 1. The marginal product of a variable input is best described as:
(a) Total product divided by the number of units of variable input.
(b) The additional output resulting from one unit increase in the variable input.
(c) The additional output resulting from one unit increase in both the variable and fixed inputs.
(d) The ratio of the amount of the variable input that is being used to the amount of the fixed input that is being used.
Answer: (b)
Question 2. Diminishing marginal returns implies:
(a) Decreasing average variable costs.
(b) Decreasing marginal costs.
(c) Increasing marginal costs.
(d) Decreasing average fixed costs.
Answer: (c)
Question 3. The short run, as economists use the phrase, is characterized by:
(a) At least one fixed factor of production and firms neither leaving nor entering the industry.
(b) A period where the law of diminishing returns does not hold.
(c) No variable inputs that is all the factors of production are fixed.
(d) All inputs being variable.
Answer: (a)
Question 4. The marginal, average, and total product curves encountered by the firm producing in the short run exhibit all of the following relationships except:
(a) When total product is rising, average and marginal product may be either rising or falling.
(b) When marginal product is negative, total product and average product are falling.
(c) When average product is at its maximum, marginal product equals average product, and total product is rising.
(d) When marginal product is at a maximum, average product equals marginal product, and total product is rising.
Answer: (d)
Question 5. To economists, the main difference between short run and long run is that:
(a) In short run all inputs are fixed, while in long run all inputs are variable.
(b) In short run the firm varies all of its inputs to find the least cost combination of inputs.
(c) In short run, at least one of the firm’s input level is fixed.
(d) In long run, the firm is making a constrained decision about how to use existing plant and equipment efficiently.
Answer: (c)
Question 6. Which one of the following statements is the best definition of production function?
(a) The relationship between market price and quantity supplied.
(b) The relationship between the firm’s total revenue and the cost of production.
(c) The relationship between the quantities of inputs needed to produce a given level of output.
(d) The relationship between the quantity of inputs and the firm’s marginal cost of production.
Answer: (c)
Question 7. Diminishing returns occur:
(a) When units of a variable input are added to a fixed input and total product falls.
(b) When units of a variable input are added to a fixed input and marginal product falls.
(c) When the size of the plant is increased in the long run.
(d) When the quantity of the fixed input, is increased and returns to the variable input falls.
Answer: (b)
Question 8. If the marginal product of labour is below the average product of labour, it must be true that:
(a) The marginal product of labour is negative.
(b) The marginal product of labour is zero.
(c) The average product of labour is falling.
(d) The average product of labour is negative.
Answer: (c)
Question 9. The average product of labour is maximized when marginal product of labour:
(a) Equals the average product of labour.
(b) Equals zero.
(c) Is maximized.
(d) None of these.
Answer: (a)
Question 10. The law of variable proportions is drawn under all of the assumptions mentioned below except the assumption that:
(a) The technology is changing.
(b) There must be some inputs whose quantity is kept fixed.
(c) We consider only physical inputs and not economically profitability in monetary terms.
(d) The technology is given and stable.
Answer: (a)
Question 11. Average product is defined as:
(a) Total product divided by the total cost.
(fa) Total product divided by the marginal product.
(c) Total product divided by the variable input.
(d) Marginal product divided by the variable input.
Answer: (c)
Question 12. The change in the total product resulting from a change in a variable input is:
(a) Average cost (b) Average product
(c) Marginal cost (d) Marginal product
Answer: (d)
Question 13. Marginal product, mathematically, is the slope of the
(a) Total product curve
(b) Average product curve
(c) Marginal product curve
(d) Implicit product curve
Answer.(a)
Question 14. Diminishing marginal returns for the first four units of a variable input is exhibited by the total product sequence:
(a) 50, 50, 50, 50
(b) 50, 110, 180, 260
(c) 50, 100, 150, 200
(d) 50, 90, 120, 140
Answer: (d)
III. Short Answer Type Questions (3-4 Marks)
Question 1. Differentiate between Short Period and Long Period.
Answer:
Question 2. Differentiate between Short Period production and Long Period production function.
Answer: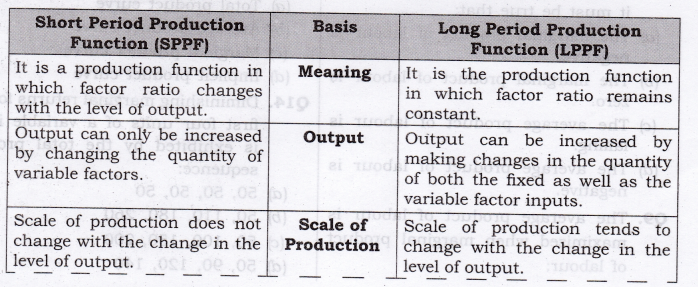
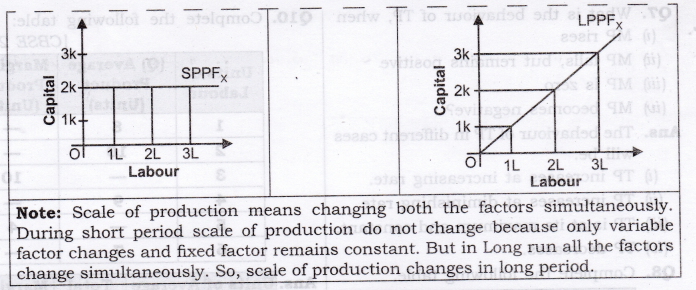
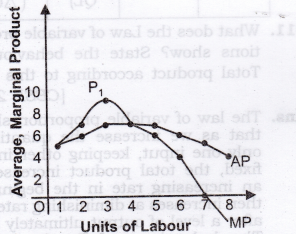
Question 3. Explain the relationship between Marginal product and Average Product. Or [CBSE 2012 C]
State the relation between Marginal product and average product. Use diagram. [AI 2013C]
Answer:
- Average Product increases as long as Marginal Product (MP) > Average Product (AP). Alternatively, when MP > AP, AP rises.
- Average Product is maximum and constant when Average Product (AP) = Marginal Product (MP). Alternatively, when AP = MP, AP is maximum.
- Average Product falls when Marginal Product < Average product.
- Marginal Product can be zero and negative but Average product is never zero.
Question 4. Explain the relationship between Total Product and Average Product.
Answer:
- When Total Product increases at an increasing rate, Average Product also increases.
- When Total Product increases at a diminishing rate, Average Product declines.
- Since Total Product is always positive, Average Product also remains throughout positive.
Question 5. Explain the relationship between Total Product, Average Product and Marginal Product.
Answer:
- In the beginning Total Product, Average Product and Marginal Product all increase, but Marginal Product > Average Product and Total Product > Marginal Product.
- When Marginal Product = 0, Total Product is maximum and constant and Average Product is decreasing.
- Thereafter, both Average Product and Marginal Product continue to decline, but Marginal Product < Average Product and Total Product declines at an absolute term.
- Marginal Product can be zero and negative but Average Product and Total Product can never be zero.
Question 6. What is the reaction of AP, when:
- MP is more than AP.
- MP is less than AP.
- MP is equal to AP.
Answer: The reaction of AP in different cases will be:
- AP will rise.
- AP will fall but it will remain positive.
- AP will be constant and at its maximum point.
Question 7. What is the behaviour of TP, when
- MP rises
- MP fails, but remains positive
- MP is zero
- MP becomes negative?
Answer: The behaviour of TP in different cases will be:
- TP increases at increasing rate.
- TP increases at diminishing rate,
- TP is at its maximum and constant.
- TP decreases.
Question 8 . Complete the following table.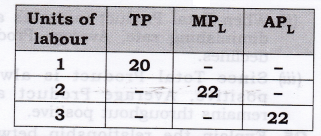
Answer: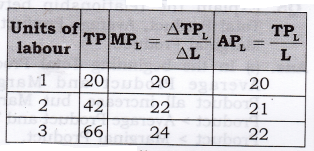
Question 9. Complete the following table.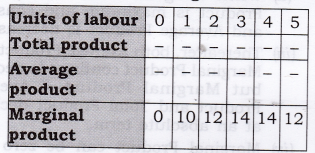
Answer: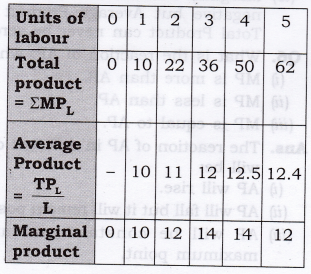
Question 10. Complete the following table: [CBSE 2013]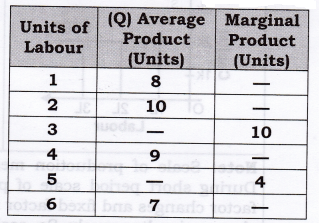
Answer: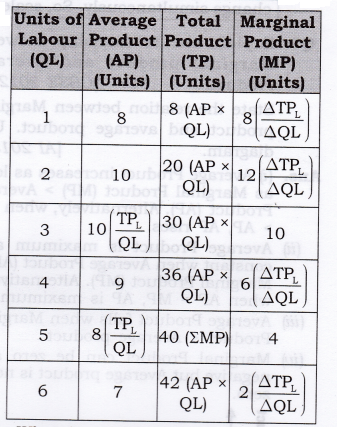
Question 11. What does the Law of variable proportions show? State the behaviour of Total product according to this Law. [CBSE 2012]
Answer: The law of variable proportion shows that as we increase the quantity of only one input, keeping other inputs fixed, the total product increases at an increasing rate in the beginning, then increases at diminishing rate and after a level of output ultimately falls. The behaviour of Total product according to this law is as under:
- TP increases continuously from points O to A.
- It increases at an increasing rate (convex shape) from O to P and at a diminishing rate (concave shape) from P to A.
- TP is maximum at A and remains so up to point B.
- After Point B, Total Product falls.
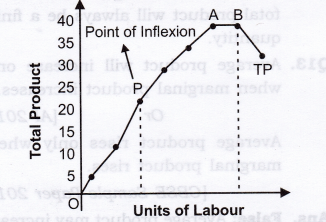
Question 12. Complete the following table: [CBSE Sample Paper 2016]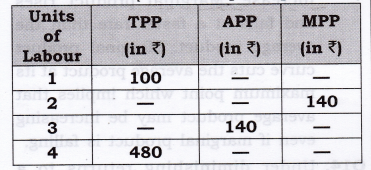
Answer: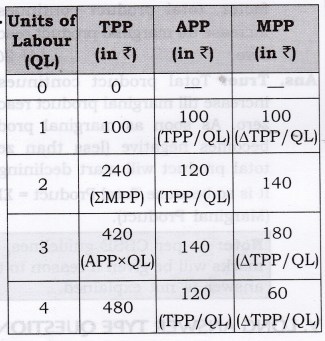
IV. True Or False
Giving reasons, state whether the following statements are true or false.
Question 1. When the quantity of a variable input is increased from 3 units to 4 units, the total output increases from 70 units to 85 units. The marginal product of the variable input is 15 units.
Answer: True: Marginal product of a variable input is an addition to total output due to one unit increase in variable input. Hence marginal product is 15/1 = 15.
Question 2. When the quantity of a variable input is increased from 4 to 6 units, the total output increases from 85 units to 105 units. The marginal product of the variable input is 20 units.
Answer: False: Marginal product is addition to the total output due to the increase in one unit variable input. Here, total output increases by 20 units due to two units increase in variable input. Hence, marginal product is 20/2 = 10 units.
Question 3. When the marginal product of a variable input falls, total product also falls.
Answer: False: Total product is defined as:
TP = MP1 + MP2 + + MPn.
Thus, as long as MP is more than zero, TP keeps increasing at a diminishing rate, although MP may be diminishing.
Question 4. When there are diminishing returns to a factor, total product always decreases. [CBSE 2009]
Answer: False: This is because when there are diminishing return to factor, then total product increase at diminishing rate.
Question 5. Total product will increase only when marginal product increases. [CBSE 2009]
Answer: False: Total product will also increase when marginal product decreases and when marginal product decreases, the total product increases at diminishing rate.
Question 6. Increase in total product always indicates that there are increasing returns to a factor. [CBSE 2009]
Answer: False: It is not necessary that the increase in total product always indicates that there are increasing returns to factor because when there are diminishing returns to factor, then also total product increases but at a diminishing rate.
Question 7. When there are diminishing returns to a factor, marginal and total product both always fall. [CBSE 2009]
Answer: False: It is so because when there are diminishing returns to factor, only marginal product tends to fall and total product tends to increase at a diminishing rate.
Question 8. When there are diminishing returns to a factor, total product first increases and then starts falling. [AI 2009, 010]
Answer: False: As when there is diminishing returns to a factor, total product increases at diminishing rate and never falls during diminishing returns. .
Question 9. Total product always increases whether there is increasing returns or diminishing returns to a factor. [ CBSE, AI 2010]
Answer: True: As when there is increasing return, total product increases at increasing rate and when there are diminishing returns, total product increases at a diminishing rate.
Question 10. If marginal product rises, average product must also rise.
Answer: True: Rising of marginal product implies that the total product increases at an increasing rate. This pulls up the average product also.
Question 11. If marginal product falls, average product must also fall. [CBSE 2010]
Answer: False: There may be an intermediate stage when the marginal product may be falling, the average product keeps rising or constant. This occurs when the fixed inputs are better utilised.
Question 12. If marginal product becomes negative, average product must also become negative.
Answer: False: Marginal product can be negative. But the average product can never be negative, because total product will always be a finite quantity.
Question 13. Average product will increase only when marginal product increases.
Or [AI 2013]
Average product rises only where marginal product rises.
[CBSE Sample Paper 2014]
Answer: False: Average product may increase even if marginal product does not increase. Marginal product rises and falls at a faster rate than the average product. Marginal product curve cuts the average product at its maximum point which implies that average product may be increasing even if marginal product is falling.
Question 14. Under diminishing returns to a factor, total product continues to increase till marginal product reaches zero. [AI 2013]
Answer: True: Total product continues to increase till marginal product reaches zero. As soon as marginal product becomes negative (less than zero), total product will start declining.
It is so because Total Product = ΣMPL, (Marginal Product).
Note: As per CBSE guidelines, no marks will be given if reason to the answer is not explained.
V. Long Answer Type Questions (6 Marks)
Question 1. State the behaviour of marginal product in the law of variable proportions. Explain the causes of this behaviour. [CBSE 2014]
Or
Giving reasons, explain the law of variable proportion. [AI.2014]
Or
What are the different phases in the Law of Variable Proportions in terms of marginal product? Give reason behind each phase. Use diagram. [AI 2015]
Answer: The behaviour of Marginal product in the law of variable proportion is as under:
- When Marginal product rises (till Point P1), Total product increases at an increasing rate (convex shape) (till point P).
- When Marginal product falls and remains positive (Till point B1), total product increases at a diminishing rate (concave shape) (till point A),
- When Marginal Product is zero (at point B1), Total Product is at its maximum and constant (At point B).
- When Marginal product becomes negative (after point B1), total product falls (after point B).
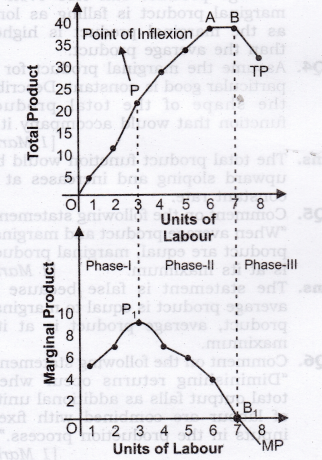
Causes or Reasons of this Behaviour is as Under:
- Phase I
(a) Proper utilization of the fixed factor
• In the initial stage of production the units of variable input (i.e., labour) is so less that fixed inputs cannot be effectively utilized.
• Proper utilization of the fixed factor can be attained when more and more units of variable factor (labour units) are applied to the fixed factor (land), the fixed factor will be used intensively and output will increase rapidly.
(b) Specialization and division of labour
• Initially there was only one labour working on all the 5 acres of land ploughing, watering, etc.
• As the number of labour units increases, each worker specialized in a particular activity leads to specialization of the variable units and this resulted in increased output. - Phase II
(a) The non-optimal combination of variable factor with the fixed factor
• When a given quantity of a fixed factor is combined with more and more units of variable factor, the additional units of variable factor will have smaller and smaller quantity of fixed factor to work with them.
• As many workers share the same fixed factor, the share of each would obviously fall. Therefore, the cooperation of the fixed factor is not available to the same extent. Thus, an increase in the variable factor would add less and less to total output.
(b) Imperfect Substitutes
• Diminishing return to factor occurs because variable factor and fixed factor are imperfect substitutes to each other.
• Technically speaking, there is a limit to which variable factor can be applied to fixed factor and that limit depends upon the efficiency of fixed factor. So, variable factor and fixed factor are imperfect substitutes to each other. - Phase III
(a) Efficiency of Variable Factor Fall
• In this stage the amount of variable factor becomes excessive relative to the fixed factor. This happens when too many LABOUR are engaged in cultivating on a given piece of land.
• Instead of helping each other in production they cause overcrowding and chaos and thus hamper each other’s work. In such a case, the contribution of additional labour to production is bound to be negative.
• Thus, the marginal returns become negative and the total returns start diminishing.
(b) Efficiency of Fixed Factor Fall
• Too much of a variable factors may also lead to the inefficiency of the fixed factor as well.
• In case of capital-, which is a fixed factor, too much of labour may cause lot of wear and tear of machinery, frequent breakdowns and excessive cost of maintenance. This is bound to affect total production adversely.
• In such a situation it is advisable to reduce the units of the variable factor than to increase it with a view for getting maximum production.
VI. Higher Order Thinking Skills
Question 1. If diminishing marginal returns will set in after the very first unit of labour is employed? What do the average product, and marginal product curves look like in this case? [3-4 Marks]
Answer: The marginal and average product curves will fall because diminishing marginal returns means that total product increases at diminishing rate that makes the average and marginal product to fall. It can be explained with the help of the given diagram.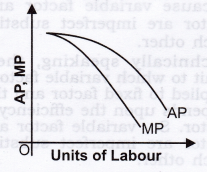
Question 2. Explain the differences between variable factors and fixed factors. [3-4 Marks]
Answer: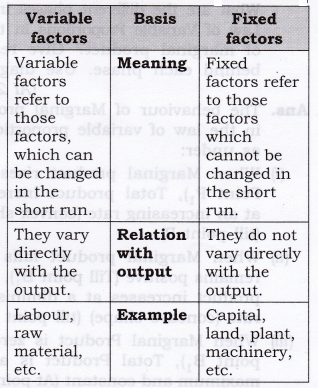
Question 3. Explain how is it possible for marginal product to fall while average product is rising? [1 Mark]
Answer: Average product can rise even if marginal product is falling as long as the marginal product is higher than the average product.
Question 4. Assume the marginal product for a particular good is constant. Describe the shape of the total product function that would accompany it. [1 Mark]
Answer: The total product function would be upward sloping and increases at a constant rate.
Question 5. Comment on the following statement: “When average product and marginal product are equal, marginal product is at its maximum.” [1 Mark]
Answer: The statement is false because if average product is equal to marginal product, average product is at its maximum.
Question 6. Comment on the following statement: “Diminishing returns occur when total output falls as additional units of labour are combined with fixed inputs in the production process.” [I Mark]
Answer: The statement is false because diminishing returns occur when marginal product falls as additional units of labour are combined with fixed inputs in the production process.
VII. Value Based Questions
Question 1. A farmer in Punjab transports wheat from the farm to a flour mill. Is this activity considered as production? Why? [ 1 Mark]
Answer: Yes, It adds to the utility and generates income.
Value: Critical thinking
Question 2. How can the productivity of Human resources be increased? [1 Mark]
Answer: The productivity of human resource can be increased with the help of human capital formation by providing training and skill to available labour force.
Value: Creative thinking.
Question 3. Availability of agricultural land (fixed factor) is limited in the world, but demand of food grain is continuously increasing. Is it possible to increase the supply of food grains by continuously increasing variable factors like seeds, fertilizers etc.? [1 Mark]
Answer: Availability of agricultural land is limited in the world, production of food grains may be increased by continuous increase in variable factors only up to a optimum combination with fixed factor. After that law of negative returns is applied.
Value: Critical thinking
Question 4. Though the contribution of plastic industry in GDP is more, yet why is it not considered an Index of social welfare? [ 1 Mark]
Answer: Because in the production of plastic product a lot of harmful gases are released in the atmosphere.
Value: Environment conservation
Question 5. Which one of the following will be treated as labour in economics? Give a reason for each.
- Preparation of food by a housewife.
- Singing for one’s own pleasure.
- Driving his master’s car by a driver.
- Playing cricket by Virat Kohli. [3-4 Marks]
Answer: (1) and (2) do not generate any income.
(3) and (4) constitute labour. These generate income.
Value: Critical thinking
Question 6. What efforts should be made in an economy for the continuous use of exhaustible natural resources in production? [3-4 Marks]
Answer: There are various efforts; namely,
- To increase use of renewable resources
- To explore the substitutes of resources
- To reduce the wastage of resources.
- To spread awareness about the effectively and optimum use of natural resources.
Value: Environmental conservation
VIII. Application Based Questions
Question 1. The data below shows the relationship between total output and the amount of labour hired at Papa’s Pizza Shop—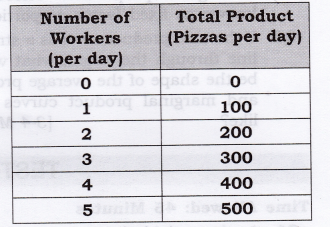
Does the production function in the above table exhibit diminishing marginal returns? Explain. [3 Marks]
Answer: No, the production function does not exhibit diminishing marginal returns. As the amount of labour hired increases, the marginal product of labour is constant. This violates the law of diminishing marginal returns.
Question 2. Give reasons for the following statements:
- Variable factor proportions obtain in the short run.
- Fixed factor proportions obtain in the long run. [3-4 Marks]
Answer:
- Short run is a period of time in which some factors are variable, and at least one factor is fixed. The level of output in a firm can be increased only by increasing the quantity of variable factors. The quantity of fixed input remains unchanged at different levels. Therefore, when variable factors are increased, whereas the quantity of fixed factor remains unchanged, the proportions between variable factors and fixed factors get changed. These are known as variable factor proportions.
- In the long run all the factors become variable because we can change both the factors of production, that is why fixed factor also becomes variable. Therefore, when the scale of production of a firm is increased, quantity of all the factors is increased in a given proportion. These are known as fixed factor proportions.
Question 3. If the total product curve is a straight line through the origin, what would be the shape of the average product and marginal product curves look like? [3-4 Marks]
Answer: When total product curve is the straight line through the origin, total product increases at a constant rate and the average and marginal product curves would coincide and be a horizontal line; Average Product and Marginal product are constant regardless of the amount of input used. It can be seen with the help of following schedule and diagrams.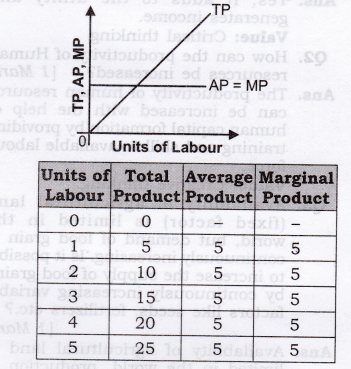
Class 12 Micro Economics Chapter 6 Cost
Question 1. Briefly explain the concept of the cost function.[1 Mark]
Answer: Cost function shows functional relationship between output and cost of production. It gives the least cost combination of inputs corresponding to different levels of output. Cost function is given as:
C = f(X), ceteris paribus,
where, C = Cost and X = Output
Question 2. What are total fixed cost, total variable cost and total cost of a firm? How are they related?
Or
Draw TVC, TC, and TFC curves in a single diagram. [AI 2012][CBSE Sample Paper 2013][3 Marks]
Answer: (i) TC is divided into two parts TFC and TVC such that TC = TFC + TVC.
(ii) TFC is the overhead cost and it remains constant or fixed whatever be the level of output. TFC curve is a horizontal line parallel to the x-axis.
(iii) TVC is cost due to increased use of variable factors like raw material, labour, etc. TVC is inverse S-shaped starting from the origin due to law of variable proportion.
(iv) TC is aggregate of TFC and TVC. TC curve is inverse S-shaped starting from the level of fixed cost. The reason behind it shape is the law of variable proportion.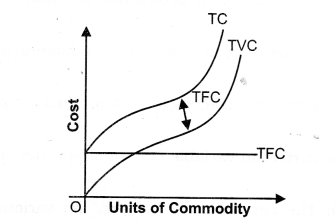
Question 3. What are the average fixed cost, average variable cost and average cost of a firm? How are they related?[3-4 Marks]
Answer: AFC: The per unit cost incurred on fixed factors of production is known as average fixed cost.
AFC always decreases as the firm increases the level of production. AVC: It is variable cost per unit of output produced.
AVC initially decreases. But after reaching the stage of minimum cost it starts increasing. AVC is U-Shaped. AC: It is cost per unit of output produced. It can be obtained by dividing the total cost by the quantity of output produced.
Relationship between AFC, AVC and AC. There is a unique relationship among AC, AFC and AVC. AC is the sum of AFC and AVC, i.e.,
AC = AFC + AVC.
Question 4. Can there be some fixed cost in the long run? If not, why? [1 Mark]
Answer: No, there are no fixed costs in the long run as all the factors become variable. Fixed cost exists only in short run.
Question 5. What does the average fixed cost curve
look like? Why does it look so?[3 Marks] Or
How does AFC behave as output is increased? [CBSE 2009C]
Or
What is the behaviour of average fixed cost as output increases?
[CBSE 2012]
Answer: The shape of AFC is downward sloping Rectangular hyperbola. AFC
falls as output increases because
Question 6. What do the short run marginal cost, average variable cost and short run average cost curves look like?[1 Mark]
Answer: The Short run marginal cost, average variable cost and short run average cost curves are U-shaped because of Law of variable proportion.
Question 7. Why does SMC curve cut AVC curve at the minimum point of AVC curve?[3 Marks]
Answer: (i) It happens because when AVC falls, SMC is less than AVC.
(ii) When AVC starts rising, SMC is more than AVC.
(iii) So, it is only when AVC is constant and at its minimum point, that SMC is equal to AVC. Therefore, SMC curve cuts AVC curve at its minimum point.
Question 8. At which point does the SMC curve cut the SAC curve? Give reason in support of your answer.[3 Marks]
Answer: (i) It happens because when SAC falls, SMC is less than SAC.
(ii) When SAC starts rising, SMC is more than SAC.
(iii) So, it is only when SAC is constant and at its minimum point, that SMC is equal to SAC. Therefore, SMC curve cuts SAC curve at its minimum point.
Question 9. Why is the short run marginal cost curve U- Shaped? [3 Marks]
Answer: Marginal cost is U-shaped because of Law of variable proportion: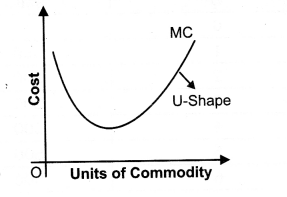
(i) As we know the shape of MC depends on the shape of TVC or TC. Let us suppose TVC.
(ii) Initially, TVC increases at a diminishing rate (Total Product increases at Increasing rate), which makes the gap of TVC, i.e. MC to fall.
(iii) Thereafter, TVC increases at an increasing rate( Total Product increases at diminishing rate) which makes the marginal cost to rise.
(iv) So, from inverse S-shape TVC curve, we derive U-shape MC curve.
Question 10. What do the long run marginal cost and average cost curves look like?
Answer: Out Of Syllabus.
Question 11. The following table shows the total cost schedule of a firm. What is the total fixed cost schedule of this firm?
Calculate the TVC, AFC, AVC, SAC and SMC schedules of the firm.[6 Marks]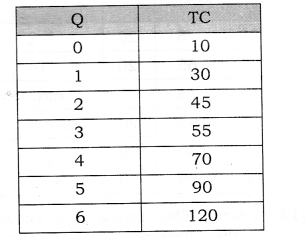
Answer: The total fixed cost will be the same at all the levels of output ranging from zero to six. For zero output, total cost is ? 10. At zero output, total variable cost will be zero. Hence, Rs. 10 represents total fixed cost at all levels of output.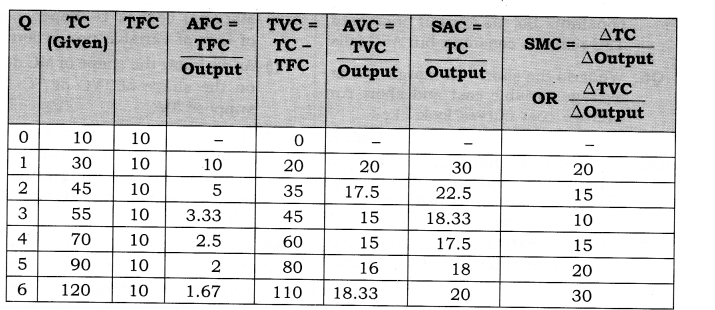
Question 12. The following table gives the total cost schedule of a firm. It Is also given that the average fixed cost at 4 units of output is Rs. 5.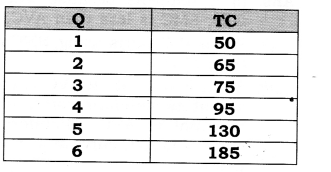
Find the TVC, TFC. AVC, AFC, SAC and SMC schedules of the firm for the corresponding values of output.[6 Marks]
Answer: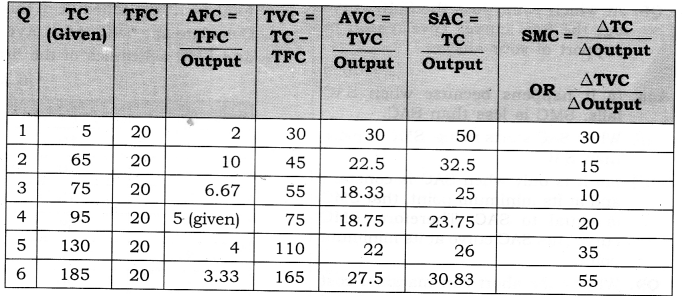
Question 13. A firm’s SMC schedule is shown in the following table. The total fixed cost of the firm is Rs. 100.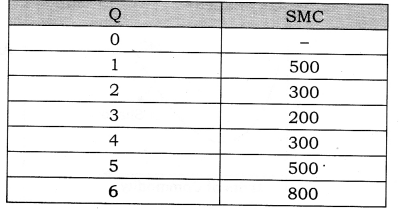
Find the TVC, TC, AVC and SAC schedules of the firm.[6 Marks]
Answer: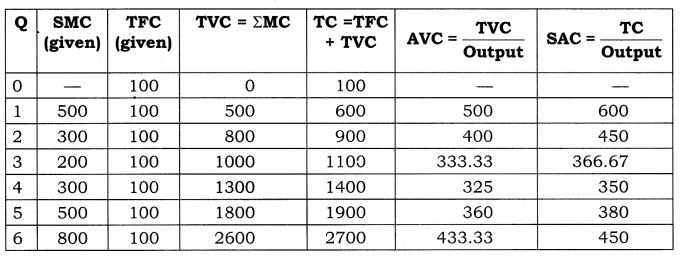
MORE QUESTIONS SOLVED
I. Very Short Answer Type Questions (1 Mark)
Question 1. Give the meaning of cost.Or [CBSE 2007]
What is meant by cost in economics? [CBSE, Sample Paper 2010} Or
What does ‘cost’ mean in economics? [CBSE 2008]
Answer: Cost of producing a good, in economics, is the sum total of explicit cost, implicit cost and certain minimum profit (normal profit).
Question 2. Give two examples of fixed cost.[ CBSE 2013]
Answer: (i) Rent of the building.
(ii) Salary of permanent employees.
Question 3. Give two examples of variable costs.
Answer: (i) Raw materials.
(ii) Labour engaged on production.
Question 4. Why is average total cost greater than average variable cost?
Answer: Because AC is sum total of AFC and AVC.
Question 5. What is meant by total cost?
Answer: During production the expenditure incurred on various factors of production is known as total cost.
Question 6. Why are TC and TVC curves parallel to each other?
Answer: TC and TVC curves are parallel to each other because the vertical gap
between them represents TFC which remains constant at all levels of output.
Question 7. How does the total fixed cost change when output changes? [CBSE 2003]
Answer: Total fixed cost does not change with the change in output.
Question 8. Give the meaning of marginal cost. [CBSE, Sample Paper 2010]
Answer: The cost incurred on additional unit of output is known as Marginal cost.
Question 9. How is MC related to TFC?
Answer: MC is independent (not related) of TFC and is affected by change in only TVC.
Question 10. How is TVC derived from MC schedule?
Answer: TVC = SMC
Question 11. What does the area under marginal cost curve show?
Answer: Area under marginal cost curve shows total variable cost.
Question 12. Can AC be less than MC when AC is rising?
Answer: Yes, AC can be less than MC, when AC is rising, as long as MC is more than AC.
Question 13. When AC curve slopes downwards, what will be the position of MC curve?
Answer: MC curve is below AC curve.
Question 14. What happens to AC when MC is equal to AC?
Answer: AC is constant and at its minimum point.
Question 15. Can AC and AVC curves touch each other?
Answer: No, because difference between AC and AVC is AFC and AFC can never be zero.
Question 16. Give two examples of explicit cost.
Answer: The two examples are: (i) Wages to worker by a firm, and (ii) rent to landlord by a firm.
Question 17. Give two examples of implicit cost of a firm.
Answer: The two examples are: (i) imputed cost of the seller’s self-owned shop; and (ii) imputed cost of family labour being used free by the seller.
Question 18. What is the behaviour of Total Variable Cost, as output increases? [AI 2012]
Answer: TVC first increases at a diminishing rate and then increases at an increasing rate.
Question 19. If it is given that the total variable cost for producing 15 units of output is Rs. 3000 and for 16 units is Rs. 3,500. Find the value of Marginal Cost. [CBSE, Sample Paper 2016]
Answer: MCn = TVCn-TVCn-1
MC16 =TVC16 – TVC15
=3500 – 3000 =500
II. Multiple Choice Questions (1 Mark)
Question 1. Which cost increases continuously with the increase in production?
(a) Average cost, (b) Marginal cost.
(c) Fixed cost. (d) Variable cost.
Answer: (d)
Question 2. Which one of the following cost curves is never ‘U’ shaped?
(a) Average cost curve.
(b) Marginal cost curve.
(c) Average variable cost curve.
(d) Average fixed cost curve.
Answer: (d)
Question 3. Total cost in the short run is classified into fixed costs and variable costs. Which one of the following is a variable cost?
(a) Cost of raw materials.
(b) Cost of equipment.
(c) Interest payment on past borrowings.
(d) Payment of rent on building.
Answer: (a)
Question 4. In the short run, when the output of a firm increases, its average fixed cost:
(a) increases.
(b) decreases.
(c) remains constant.
(d) first declines and then rises.
Answer: (b)
Question 5. Which one of the following statements
is correct?
(a) When the marginal cost is rising, the average cost must also be rising.
(b) When the average cost is rising, the marginal cost must be falling.
(c) When the average cost is rising, the marginal cost is above the average cost.
(d) When the average cost is falling, the marginal cost must be rising.
Answer: (c)
Question 6. Which one of the following statements is an example of “explicit cost”?
(a) The wages a proprietor could have made by working as an employee of a large firm.
(b) The income that could have been earned in alternative uses by the resources owned by the firm.
(c) The payment of wages by the firm.
(d) The normal profit earned by a firm.
Answer: (c)
Question 7. Which one of the following statements
is an example of an “implicit cost”?
(a) Interest that could have been earned on retained earnings used by the firm to finance expansion.
(b) The payment of rent by the firm for the building in which it is housed.
(c) The interest payment made by the firm for funds borrowed from a bank.
(d) The payment of wages by the firm.
Answer: (a)
Question 8. Marginal cost is defined as:
(a) The change in total cost due to a one unit change in output.
(b) Total cost divided by output.
(c) The change in output due to a one unit change in an input.
(d)Total product divided by the quantity of input.
Answer: (a)
Question 9. Which one of the following statements is true to the relationship between marginal cost function and average cost function?
(a) If MC is greater than ATC, ATC is falling.
(b) ATC curve intersects MC curve at minimum MC.
(c) MC curve intersects ATC curve at minimum ATC.
(d) If MC is less than ATC, ATC is increasing.
Answer: (c)
Question 10. Which one of the following statements is true to the relationship among the average cost functions?
(a) ATC = AFC – AVC.
(b) AVC = AFC + ATC.
(c) AFC = ATC + AVC.
(d) AFC = ATC – AVC.
Answer: (d)
Question 11. Which one of the following elements is not a determinant of the firm’s cost function?
(a) The production function.
(b) The price of labour. (c) Taxes.
(d) The price of the firm’s output.
Answer: (d)
Question 12. Which one of the following statements is correct concerning the relationships among the firm’s cost functions?
(a) ATC=AFC-AVC
(b) AVC = AFC + ATC.
(c) AFC = ATC + TVC.
(d) AFC = ATC – AVC.
Answer: (c)
Question 13. Suppose output increases in the short run, than the Total cost will:
(a) increase due to an increase in fixed costs only.
(b) increase due to an increase invariable costs only.
(c) increase due to an increase in bothfixed and variable costs.
(d) decrease if the firm is in the regionof diminishing returns.
Answer: (b)
Question 14. A firm’s average fixed cost is Rs.20 at 6 units of output. What will it be at 4 units of output?
(a) Rs.60 (b) Rs.30
(c) Rs.40 (d) Rs.20
Answer: (b)
Question 15. If marginal cost equals to average total cost,
(a) average total cost is falling
(b) average total cost is rising
(c) average total cost is maximized
(d) average total cost is minimized
Answer: (d)
Question 16. When marginal costs are below
average total costs,
(a) average fixed costs are rising
(b) average total costs are falling
(c) average total costs are rising
(d) average total costs are minimized
Answer: (b)
Question 17. If the average cost is falling,
(a) marginal cost is rising
(b) marginal cost is falling
(c) marginal cost is equal to average cost
(d) it is impossible to tell if marginal cost is rising or falling
Answer: (d)
Question 18. The difference between average total cost and average variable cost:
(a) is constant
(b) is total fixed cost
(c) gets narrow as output decreases
(d) is the average fixed cost
Answer: (d)
Question 19. If the total cost curve is parallel to X-axis, marginal cost will:
(a) increase (b) decrease
(c) zero (d) None of these.
Answer: (c)
Question 20. The total cost at 5 units of output is Rs. 30. The fixed cost is Rs. 5. The average variable cost at 5 units of output is: [CBSE Sample Paper 2014]
(a)Rs.25 (b)Rs.6
(c)Rs.5 (d)Rs.1
Answer: (c)
III. Short Answer Type Questions (3-4 Marks)
Question 1. Define total fixed cost (Supplement/ Indirect/overhead cost).
Or
Define fixed cost.[AI 2004, 06, 07; CBSE 2008C, 09] Or
What is meant by fixed (supplementary) costs of a firm? Give examples.
[AI 2007; CBSE 2004, 04C, 07C]
Answer: (i) Fixed costs are those costs of production which do not change with a change in output.
(ii) These are the costs incurred on fixed factors, like rent of land and building, interest, etc. These are unavoidable contractual costs.
(iii) Fixed costs are also called overhead costs or general costs because these are common for all the units produced. These costs are also called supplementary costs or indirect costs.
(iv) The shape of Total fixed Cost is horizontal (Parallel to X-Axis). They have to be incurred when the output is large or small or even zero.
Question 2. What is meant by variable (prime) cost of a firm? Give examples. [CBSE 2004 C; AI 2004]
Answer: (i) The cost incurred on variable factors of production is known as TVC.
(ii) TVC is very much related with the production and fluctuates with the fluctuation in production.
(iii) In case of zero level of production, TVC would also be zero.
(iv) For example, Wages of casual labour, payment for raw material, etc.
Question 3. Explain the behaviour of aver age fixed cost using numerical example. [CBSE 2013C]
Answer: (i) The per unit cost incurred on fixed factors of production is known as average fixed cost.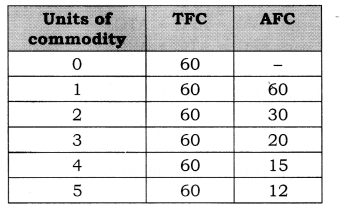
AFC falls as output increases because
Question 4. Distinguish between variable cost and fixed cost. Give two examples of each.[AI 2004, 08; CBSE 99C, 2000C]
Answer: 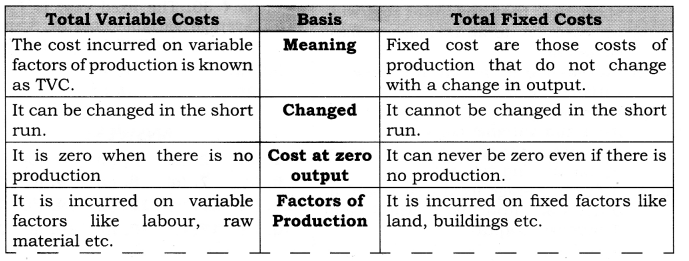

Question 5. Why is AC curve U-shaped in short run? Or
Why is AC curve U-shaped?[AI 2006; CBSE 07C, 10Q]
Answer: Average Cost is U-Shaped because of Law of variable proportion:
(i) The shape of average cost (AC) depends upon total cost (TC).
(ii) Initially, total cost (TC) increases at a diminishing rate (Total Product increases at Increasing rate), which makes its average, i.e., average cost (AC) to fall, then reaches its minimum point.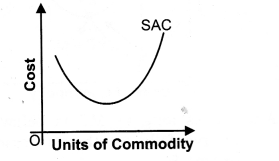
(iii) Thereafter, total cost (TC) increases at increasing rate (Total Product increases at diminishing rate), which makes the average cost (AC) to rise. This type of production behaviour shows operation of law of variable proportion.
Question 6. An individual is both the owner and the manager of a shop taken on rent. Identify implicit cost and explicit cost from this information. Explain. [CBSE 2012]
Answer: (i) For producing a commodity, a firm requires factor inputs (like services of land, labour, capital etc.) and non-factor inputs (like raw material, electricity, fuel etc.).
(ii) Actual money spent by a firm on buying and hiring of factor and non¬factor inputs is called explicit cost. As per question, rent paid for the shop is an explicit cost.
(iii) Implicit cost is the imputed or estimated value of inputs supplied by the owner of the firm himself. As, per question, imputed salary of the owner working as manager, imputed interest on self-supplied capital, etc. are implicit costs.
cost and implicit cost.
Question 7. State the distinction between explicit each.Give an example of each?
Answer: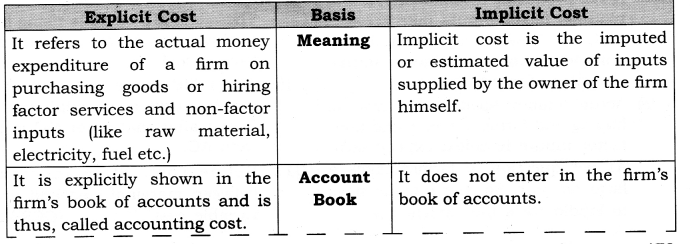

Question 8. A producer starts a business by investing his own savings and hiring the labour. Identify implicit and explicit costs from this information. Explain. [AI 2012]
Answer: (i) For producing a commodity, a firm requires factor inputs (like services of land, labour, capital etc.) and non-factor inputs (like raw material, electricity, fuel efc.).
(ii) Actual money spent by a firm on buying and hiring of factor and non¬factor inputs is called explicit cost. As per question, a producer is hiring the labour, than the wages and salary paid to labour is a explicit cost.
(iii) Implicit cost is the imputed or estimated value of inputs supplied by the owner of the firm himself. As, per question, if a producers start a business by investing his own savings, than the imputed interest on self-supplied capital he earned is a implicit cost.
Question 9. A farmer takes a farm on rent and carries on farming with the help of his family members. Identify explicit and implicit costs from this information. Explain. [AI 2012]
Answer: (i) For producing a commodity, a firm requires factor inputs (like services of land, labour, capital etc.) and non-factor inputs (like raw material, electricity, fuel etc.).
(ii) Actual money spent by a firm on buying and hiring of factor and non¬factor inputs is called explicit cost. As per question, a farmer takes a farm on rent. So, the rent he pays to landloard is the explicit cost.
(iii) Implicit cost is the imputed or estimated value of inputs supplied , by the owner of the firm himself. As per question, if a farmer carries on farming with the help of family members, even then the imputed wages will be an implicit cost.
Question 10. Explain the relationship between AC and MC with the help of a diagram.
[CBSE 2000C, 2001, 07, 07C, 09C; AI 2004, 08, 11]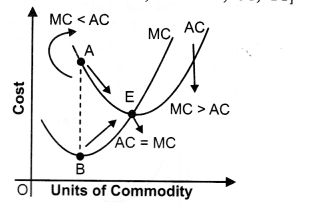
Answer: (i) As long as MC is below AC, AC curve falls till their intersection at point E.
(ii) When MC curve comes to fall, it falls more rapidly than AC curve and reaches its minimum point B earlier than the AC curve reaches its minimum point E.
Therefore, MC curve is rising from B to E whereas AC curve is still falling from A to E.
(iii) When MC curve is rising, it cuts the AC curve at its minimum point E and after that point MC is above than AC.
Question 11. Define cost. State the relation between marginal cost and average variable cost. [CBSE 2015]
Answer: Cost is the sum total of explicit cost, implicit cost and certain minimum profit (normal profit).
(i) As long as MC is below AVC, AVC curve falls till their intersection at point E.
(ii) When MC curve comes to fall, it falls more rapidly than AVC curve and reaches its minimum point B earlier than the AVC curve reaches its minimum point E.
Therefore, MC curve is rising from B to E whereas AVC curve is still falling from A to E.
(iii) When MC curve is rising, it cuts the AVC curve at its minimum point E and after that point MC is above than AVC.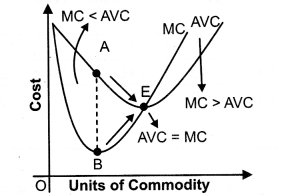
Question 12. What is the behaviour of (a) Average Fixed Cost and (b) Average Variable Cost as more and more units of a good are produced? [A1 2015]
Answer: (a) The average fixed cost falls as more and more units of goods are produced. It is so because average fixed cost is equal to . Total Fixed Cost (TFC)
Output
and total fixed cost remains constant with increase in level of output. So, with constant total fixed cost and increasing output, the average fixed cost falls.
(b) Average Variable Cost (AVC) is U-shaped with increase in output because of Law of Variable Proportion.
(i) As we know the shape of AVC depends upon the shape of Total Variable Cost (TVC). Initially, TVC increases at diminishing rate (because Total Product Increases at increasing Rate), that makes the AVC to fall.
(ii) Thereafter, TVC increases at increasing rate (because Total Product Increases at diminishing Rate), that makes the average variable cost to rise.
(iii) So, from inverse S-shape, TVC curve, we derive the U shape AVC curve.
Question 13. Can MC increase when AC falls?
Answer: Yes, it can happen when MC is below, than AC at the time of MC increases. The reason is that MC is confined to only one unit of the commodity produced whereas AC is related to all the units of commodity produced. As a result when MC increase, in case of MC, the whole increase is confined to the concerned one unit but in case of AC, this increase is shared by all the units of commodity produced. As the result of, rising MC is unable to bring about an increase in AC.
Question 14. Find out the total fixed cost in the following: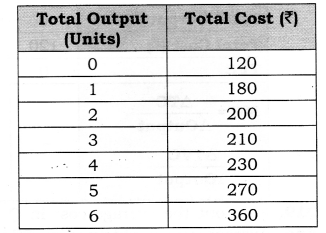
Answer: The total fixed cost will be the same at all the levels of output, ranging from zero to six. For zero output, total cost is Rs 120. At zero output, total variable cost will be zero. Hence, Rs 120 represents total fixed cost at all levels of output
Class 12 Micro Economics Chapter -7 Supply
Question 1. Consider a market with two firms. The following table shows the supply schedules of two firms: the SS1 column gives supply schedule of firm 1 and SS2 column gives supply schedule of firm 2. Compute the market supply schedule. [3 Marks]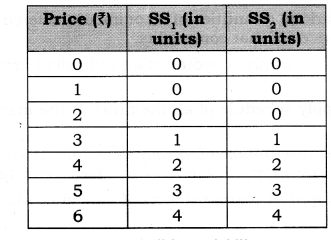
Answer: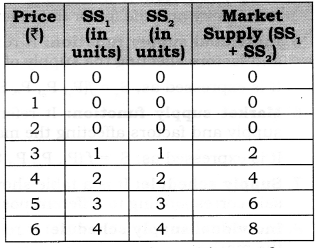
Question 2. Consider a market with two firms. In the following table, columns labelled as SS1 and SS2 give the supply schedules of firm 1 and firm 2 respectively. Compute the market supply schedule. [3 Marks]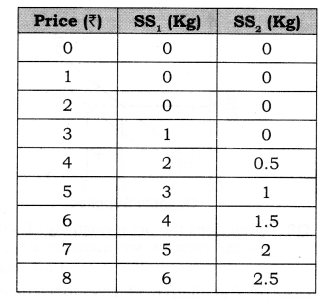
Answer: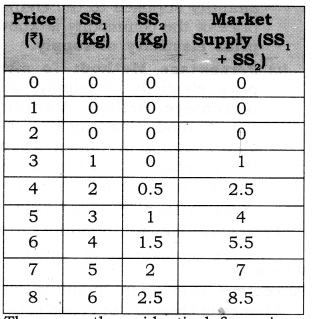
Question 3. There are three identical firms in a market. The following table shows the supply schedule of firm 1. Compute the market supply schedule. [3 Marks]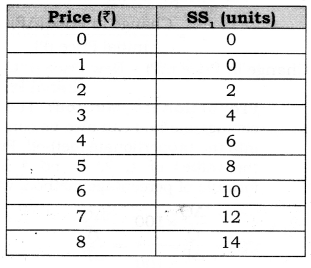
Answer: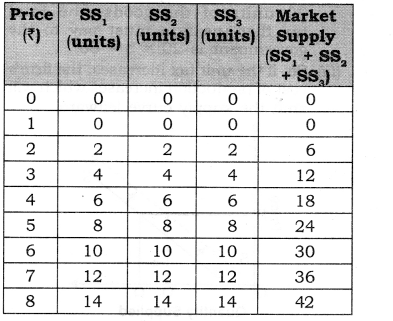
of the second firm (SS2) and the third firm (SS3) will be equal to the supply of first firm (SS,).
Question 4. How does technological progress affect the supply curve of a firm? [3 Marks]
Answer: When there is technological progress in the firm, then cost of production will decrease, which leads to increase in the profit margin of the firm and thereby shifts the supply curve rightward as showm.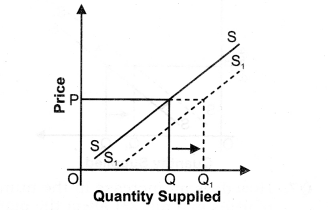
Question 5. How does the imposition of a unit tax affect the supply curve of a firm? [3 Marks]
Answer: (i) A unit tax is a tax that the government imposes per unit sale of output.
(ii) For example, suppose that the unit tax imposed by the government is Rs 3.
Then, if the firm produces and sells 20 units of the goods, the total tax that the firm must pay to the government is 20 x 3 = 60.
(iii) So, if the unit tax increases, the firm’s cost of production increases which will shift the supply curve leftward.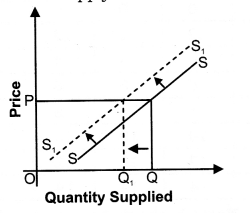
Question 6. How does an increase in price of an input affect the supply curve of a firm? [3 Marks]
Answer: (i) This also influences the supply since price of inputs (rent, wages, interest, profit) constitutes the cost of production of a commodity.
(ii) An increase in the price of an input may lead to rise in cost of production, which will thereby decrease the production of a commodity shifting the supply curve to the left as shown.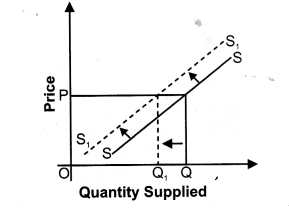
Question 7. How does an increase in the number of firms in a market affect the market supply curve? [3 Marks]
Answer: (i) When the number of firms in the industry increases, market supply also increases due to large number of producers producing that commodity.
(ii) So, due to increase in market supply, the supply curve shifts rightward as shown.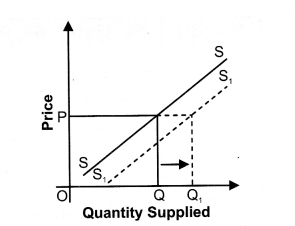
Question 8. What does the price elasticity of supply mean? How do we measure it? [3-4 marks]
Answer: (i) The degree of responsiveness of quantity supplied to the changes in price of the commodity is known as price elasticity of supply.
(ii) Percentage Method: To measure price elasticity of supply, we use percentage method. According to this method, elasticity is measured as the ratio of percentage change in the quantity supplied to percentage change in the price.Price elasticity of supply (ES) Percentage change in quantity supplied Percentage change in price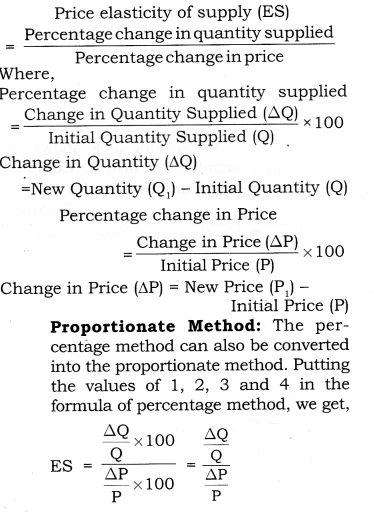
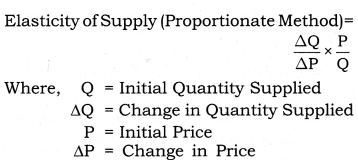
Question 9. What is the supply curve of a firm in the short run? [3 Marks]
Answer: (i) In the short period, supply is relatively less elastic as firm can change the supply by changing the variable factors only, as fixed factors remain fixed during short period.
(ii) The supply curve during short period is inelastic, ie., percentage change in quantity supplied is less than percentage change in price as shown below: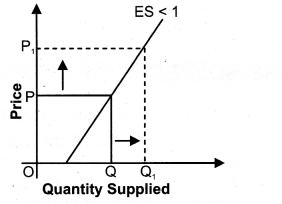
Question 10. What is the supply curve of a firm in the Long run? [3 Marks]
Answer: (i) In the long period, supply is more elastic as all the factors can be changed and supply can be easily adjusted as per changes in price.
(ii) The supply curve during long period is elastic, i.e., percentage change in quantity supplied is greater than per¬centage change in price as shown below: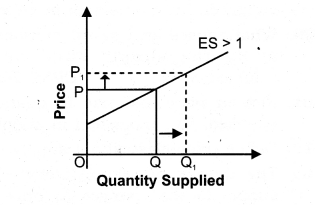
Question 11. At the market price of Rs. 10, a firm supplies 4 units of output. The market price increases to Rs. 30. The price elasticity of the firm’s supply is 1.25. What quantity will the firm supply at the new price? [3 Marks]
Answer: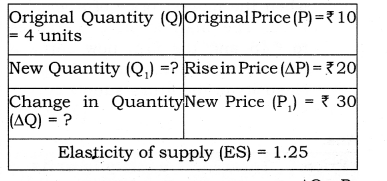
Question 12. The market price of a good changes from Rs. 5 to Rs. 20. As a result, the quantity supplied by a firm increases by 15 units. The price elasticity of the firm’s supply curve is 0.5. Find the initial and final output levels of the firm. [3 Marks]
Answer: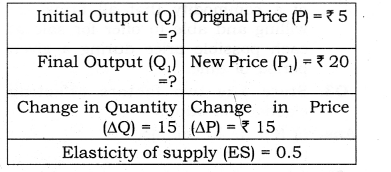
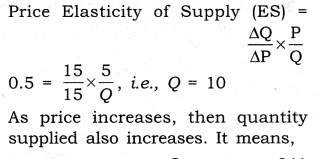
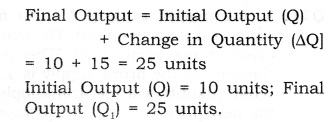
Question 13. A firm earns a revenue of Rs. 50 when the market price of a good is Rs. 10. The market price increases to Rs. 15 and the firm now earns a revenue of Rs. 150. What is the price elasticity of the firm’s supply curve?
Answer: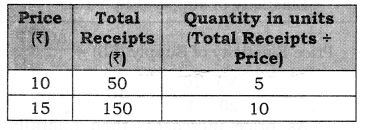
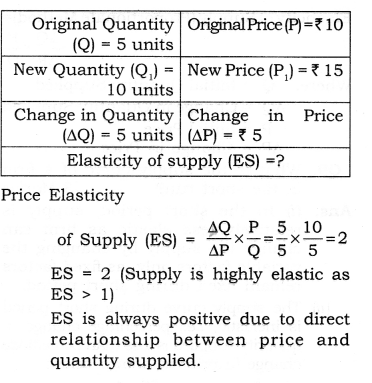
ES is always positive due to direct relationship between price and quantity supplied.
MORE QUESTIONS SOLVED
1. Very Short Answer Type Questions (1 Mark)
Question 1. Define supply. [CBSE, Foreign 2004]
Answer: Supply refers to the quantity of a commodity that a firm is willing and able to offer for sale, at each possible price during a given period of time.
Question 2. Define market supply. [CBSE 2005]
Answer: Market supply refers to the quantity of a commodity that all firms are willing and able to offer for sale at each possible price during a given period of time.
Question 3. State any two factors affecting elasticity of supply.
Answer: (i) Nature of commodity;
(ii) Time period.
Question 4. What effect does an decrease in input price has on the supply of the commodity?
Answer: Supply will increase.
Question 5. What is the shape of a supply curve?
Answer: Supply curve is a positively shaped upward sloping curve.
Question 6. State the law of supply. [CBSE 2003]
Answer: It states that price of the commodity and quantity supplied are positively related to each other when other factors remain constant (ceteris paribus).
Question 7. What causes a movement along the supply curve of a good? [CBSE 2004]
Answer: Change (increase or decrease) in price causes a movement along the supply curve.
Question 8. What causes a downward movement along a supply curve? [CBSE 2004, 09]
Answer: Fall in price and fall in quantity supplied, i.e., contraction in supply.
Question 9. What causes an upward movement along the supply curve of a commodity? [CBSE 2004]
Answer: Rise in price and rise in quantity supplied, i.e., expansion in supply.
Question 10. Define price elasticity of supply.
Answer: The degree of responsiveness of supply to the changes in price of the commodity is known as Price Elasticity of Supply.
Question 11. If the quantity supplied does not change at all as price changes, what will be the elasticity of supply?
Answer: Perfectly inelastic supply (ES = 0).
Question 12. What is the price elasticity of supply of a commodity whose straight line supply curve passes through the origin forming an angle of 75°? [CBSE Sample Paper 2010]
Answer: Unitary elastic (ES = 1).
Question 13. When is the supply of a commodity called ‘elastic’? [CBSE 2006\
Answer: The supply of a commodity is called ‘elastic’ when the percentage change in quantity supplied is more than percentage change in price, then ES > 1 and the result is known as more than unit elastic supply.
Question 14. Price elasticity of supply of a good is 0.8. Is the supply ‘elastic’ or ‘inelastic’, and why? [CBSE Outside, CBSE 2006]
Answer: When PES = 0.8, PES is inelastic because percentage change in quantity supplied is less than percentage change in price.
Question 15. What is meant by perfectly elastic supply of a commodity? [CBSE 08C]
Answer: When quantity supplied changes and price remains constant, then the supply of such commodity is said to be perfectly elastic.
Question 16. Price elasticity of supply of a good is 1.5. Is the supply ‘elastic’ or ‘inelastic’, and why?
Answer: When PES = 1.5, PES is elastic because percentage change in quantity supplied is more than percentage change in price.
II. Multiple Choice Questions (1 Mark)
Question 1. A vertical supply curve parallel to Y-axis implies that the elasticity of supply is:
(a) Zero (b) Infinity
(c) Equal to one
(d) Greater than zero but less than infinity.
Answer: (a)
Question 2. The supply of a good refers to:
(a) Actual production of the good.
(b) Total existing stock of the good. (c) Stock available for sale.
(d) Amount of the good offered for sale at a particular price per unit of time.
Answer: (d)
Question 3. An increase in the supply of a good is caused by:
(a) Improvements in its technology.
(b) Fall in the prices of other goods. (c) Fall in the prices of factors of production.
(d) All of them.
Answer: (d)
Question 4. Elasticity of supply refers to the degree of responsiveness of supply of a good to changes in its:
(a) Demand. (b) Price.
(c) Cost of production.
(d) State of technology.
Answer: (b)
Question 5. A horizontal supply curve parallel to the quantity axis implies that the elasticity of supply is:
(a) Zero. (b) Infinite.
(c) Equal to one.
(d) Greater than zero but less than one.
Answer: (b)
Question 6. Contraction of supply is the result of:
(a) Decrease in the number of producers. (b) Decrease in the price of the goods concern.
(c) Increase in the prices of other goods. (d) Decrease in the outlay of sellers.
Answer: (b)
Question 7. The quantity supplied of a piece of goods or service is the amount that
(a) is actually bought during a given time period at a given price.
(b) producers wish that they could sell that at a higher price.
(c) producers plan to sell during a given time period at a given price.
(d) people are willing to buy during a given time period at a given price.
Answer: (c)
Question 8. Supply is the
(a) limited resources that are available with the seller.
(b) cost of producing a good.
(c) entire relationship between the quantity supplied and the price of good.
(d) willingness to produce a good if the technology to produce it becomes available.
Answer: (c)
Question 9. Elasticity of supply is measured by dividing the percentage change in quantity supplied of a good by .
(a) percentage change in income
(b) percentage change in quantity demanded of good
(c) percentage change in price
(d) percentage change in taste and preference
Answer: (c)
Question 10. Elasticity of supply is zero means
(a) perfectly inelastic supply
(b) perfectly elastic supply
(c) imperfectly elastic supply
(d) none of them
Answer: (a)
Question 11. Elasticity of supply is greater than one when . __
(a) Proportionate change in quantity supplied is more than the proportionate change in price.
(b) Proportionate change in price is greater than the proportionate change in quantity supplied.
(c) Change in price and quantity supplied are equal
(d) None of them
Answer: (a)
Question 12. If the quantity supplied is exactly equal to the relative change in price then the elasticity of supply is .
(a) less than one (b) greater than one
(c) one (d) none of them
Answer: (c)
Question 13. If the percentage change in supply is less than the percentage change in price, it is called .
(a) unit elasticity of supply
(b) less elastic supply
(c) more elastic supply
(d) inelastic supply
Answer: (b)
Question 14. The supply curve shifts to the right because of .
(a) improved technology
(b) increased price of factors of production
(c) increased excise duty
(d) all of them
Answer: (a)
Question 15. Supply is a concept.
(a) stock (b) flow and stock
(c) flow (d) none of them
Answer: (c)
16. In a very short period market:
(a) The supply is fixed.
(b) The demand is fixed.
(c) Demand and supply are fixed.
(d) None of them.
Answer: (a)
III. Short Answer Type Questions (3-4 Marks)
Question 1. Explain the concept of law of supply.
Or
State law of supply. [A1 2004]
Or
What is meant by the assumption, ‘other things remaining the same’ on which law of supply is based?[CBSE 2010]
Answer: It is based on certain assumptions. If these assumptions fulfil in the economy, Law of supply states that positive relationship exists between price of the commodity and quantity supplied of that commodity.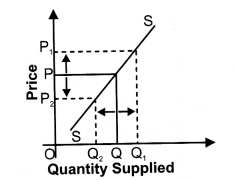
“Other things being constant (ceteris paribus), based on the price of the commodity” is called Law of Supply. It means due to rise in price of a commodity its quantity supplied also rises
and vice-versa.
The assumptions are as under:
(a) Price of other commodity remains constant.
(b) Technology of production should not change.
(c) Cost of production remains constant.
(d) Goal of the firm remains constant.
(e) Taxation policy of the government should not change.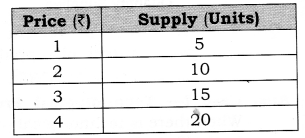
Question 2. Under what condition, a producer would like to supply more at a given level of price?
Or
What is increase in supply? Explain three causes of increase in supply.
Or [CBSE 2007, 11} State factors that can cause a rightward shift of supply curve. [AI 2002, 04; CBSE 04, 05C, 06]
Answer: An increase in supply means that producers now supply more at a given price level.
The conditions or causes are:
(a) Fall in the prices of other goods.
(b) Fall in the prices of remuneration of factors of production.
(c) Improvement in Technology.
(d) Change in objective of producer (increase the supply at the same rate).
(e) Taxation policy of government falls.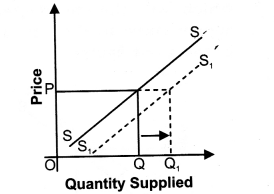
Question 3. Under what conditions, a producer would like to supply less at a given price?
Or
Explain only two causes of decrease in supply of a commodity.[CBSE 2010, 10C; AI11] Or
State factors for leftward shift of supply curve. [AI 2006]
Answer: A decrease in supply means that producers now supply less at a given price level. The conditions are:
(a) Rise in the prices of remuneration of factors of production.
(b) Rise in the prices of other goods.
(c) When the technology becomes outdated.
(d) Change in the objective of producer (decrease supply at the same price).
(e) Taxation policy of government rises.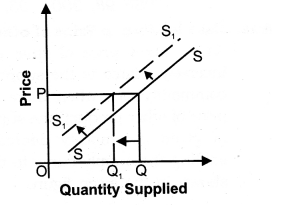
Question 4. Explain how changes in prices of inputs influence the supply of a product. [AI 2012, CBSE 2013 ]
Answer: Case I— When price of input rises:
Due to rise in price of input the cost of production of a firm increases, which will thereby decrease the supply curve to the left as shown in the given figure.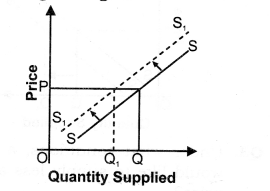
Case II— When price of input falls:
Due to fall in price of input, the cost of production of a firm decreases which will thereby increase the supply curve to the right as shown in the given figure.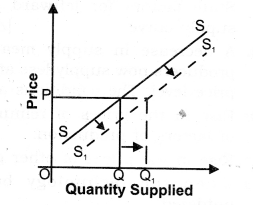
Question 5. Explain effect of ‘change in prices’ of other products on supply of a given product. [AI 2012, CBSE 98, 2001, 03, 05, 13C]
Answer: Case I— Rise in Price of other Goods: As we know price of other goods are inversely related to the supply of given commodity. So, when there is rise in price of other product, the supply curve of given commodity decreases and shifting the supply curve to the left as shown in the given figure.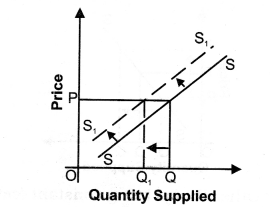
Case II— Fall in price of Other goods: As, against it, if there is fall in price of other product, the supply curve of a given commodity increases and shifting the supply curve to the right as shown below: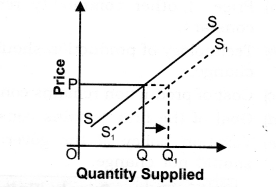
Question 6. Explain effect of technological changes on supply of a product. [AI 2001; CBSE 2005C]
Answer: Case I— Technological Progress:
When there is technological progress in the firm, then cost of production will decrease, which leads to increase in the profit margin of the firm and thereby shifts the supply curve shifts rightward as shown below: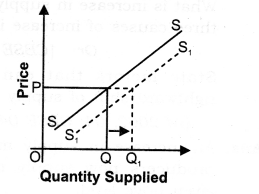
Case II— Outdated Technology:
Supply of those goods which are being produced with old and inferior technology causing increase in cost of production will decrease the total output and shift the supply curve to the left.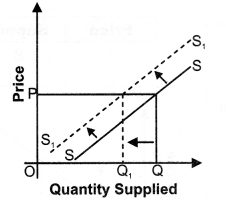
Question 7. What would be an effect on supply curve of the following:
(a) Decrease in tax on product.[CBSE 06C, 11; AI 08]
(b) Subsidy on production of goods.[CBSE 2011,13C]
(c) Rise in own price of a piece of goods. ‘ [CBSE 201 I]
Answer: (a) Decrease in tax on product: Due to decreasein tax on product the cost of production of a firm decreases and supply of a given commodity increases and thereby shifts the supply curve rightward as shown in the given figure: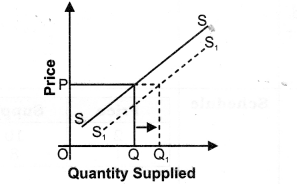
(b) Subsidy on production of goods:
If a government gives subsidy to a firm for production of goods, the cost of production of firm decreases for producing this goods, that will increase the supply and thereby shifting in the supply curve to the right as shown in the given figure: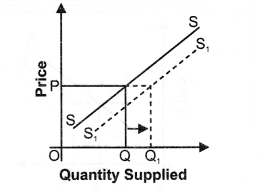
(c) Rise in own price of a good: Due to rise in own price of a good, the quantity supplied for a given commodity also rises because there is positive relationship between own price of a good and quantity supplied of a given commodity. So, due to rise in price of a commodity, there will be upward movement along the supply curve as given below: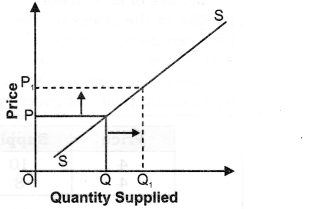
Question 8. Differentiate between increase in supply quantity supplied and expansion in supply increase in [CBSE 2000, 02, 09]
Answer: 
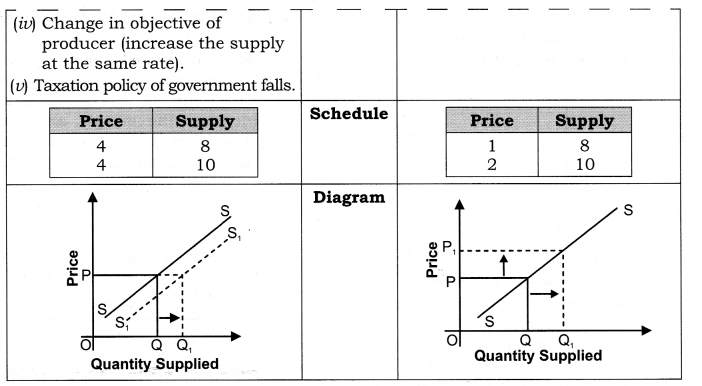
Question 9. Differentiate between decrease in supply and contraction in supply (decrease in quantity supplied). [Delhi 2000C]
Answer: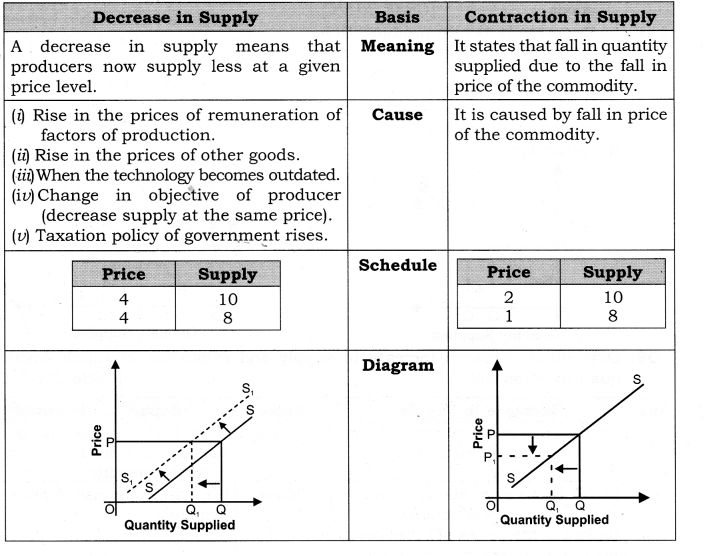
Numerical problems on Calculation of elasticity of supply (When both price and quantity are given)
Question 10. If price of a commodity falls from Rs. 50 per unit to Rs. 45 per unit, its supply falls from 1000 units to 800 units. Find out its elasticity of supply.
Answer: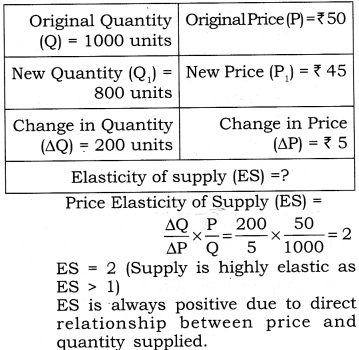
Class 12 Micro Economics Chapter 8 Revenue
Question 1. How are the total revenue of a firm, market price, and the quantity sold by the firm related to each other?[1 Mark]
Answer: Total Revenue = Market Price x Quantity sold
Question 2. Compute the total revenue, marginal revenue and average revenue schedules in the following table. Market price of each unit of good is Rs. 10.
Answer:
Question 3. What would be the shape of the demand curve so that the total revenue curve is
(a) A positively sloped straight line passing through the origin?
(b) A horizontal line?[3-4 Marks]
Answer: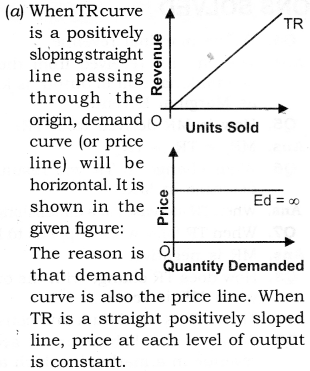
(b) When TR is a horizontal line, demand curve is a rectangular hyperbola. It is shown: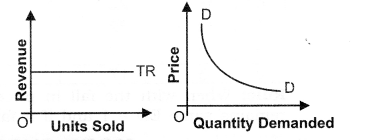
The reason is that,the price at each level of output declines.
Question 4. Comment on the shape of the MR curve in case the TR curve is a (i) positively sloped straight line, (ii) horizontal straight line. [3-4 Marks]
Answer: (i) When TR curve is positively sloped straight line, MR is a horizontal line. MR coincides with the demand curve. Price or AR is constant at each level of output.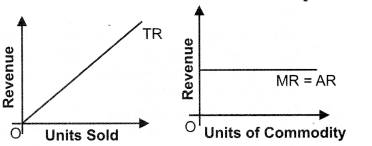
When AR is constant, MR is also constant.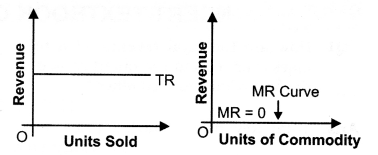
(ii) When TR is a horizontal straight line, MR is zero. It is because horizontal TR means when price falls, quantity demanded rises in the same proportion. Thus, MR is zero. MR curve coincides with the x-axis
Question 5. From the schedule provided below calculate the total revenue, demand curve and the price elasticity of demand:
Answer: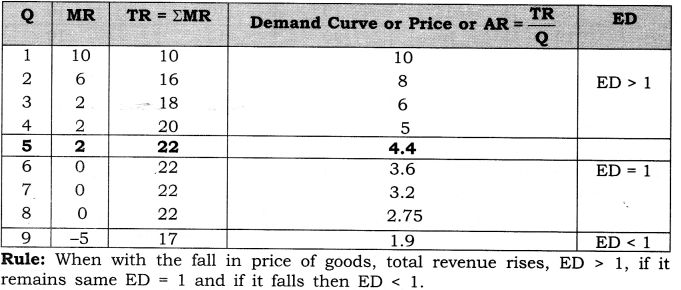
MORE QUESTIONS SOLVED
I. Very Short Answer Type Questions (1 Mark)
Question 1. Give the meaning of revenue. Or [CBSE 2007]
Define revenue. [CBSE 2008]
Answer: Revenue of a firm refers to receipts from the sale of output in a given period.
Question 2. Define total revenue.[CBSE, All India 2004]
Answer: The amount received from the sale of given amount of output is known as Total Revenue.
For example, if a firm sells 100 chairs at a price of ? 200 per chair, The total revenue will be 100 Chairs x Rs. 200 = Rs 20,000.
Question 3. Define average revenue.[CBSE, Foreign 2004]
Answer: The per unit amount received from the sale of given amount of output.
Question 4. Define marginal revenue.
Answer: The amount received from the sale of additional unit of output is known as Marginal Revenue.
Question 5. How is MR derived from TR?
Answer:
Question 6. What change in TR will result in a decrease in MR?
Answer: When TR increases at a diminishing rate.
Question 7. When TR falls, what happens to MR?
Answer: MR is negative.
Question 8. How does TR change with the output when MR is zero?
Answer: Then, TR is maximum and constant.
Question 9. What is the behaviour of average revenue in a market in which a firm can sell more only by lowering the price? [CBSE 2012]
Answer: Average revenue will fall.
Question 10. What is the behaviour of Marginal Revenue in a market in which a firm can sell any quantity of the output it produces at a given price? [AI 2012]
Answer: Marginal revenue remains constant.
II. Multiple Choice Questions (1 Mark)
Question 1. Assume that when price is Rs.20, the quantity demanded is 9 units, and when price is Rs.19 the quantity demanded is 10 units. Based on this information what is the marginal revenue resulting from an increase in output from 9 units to 10 units.
(a) Rs.20 (b)Rs.19 (c) Rs.10 (d) Rs. 1
Answer: (c)
Question 2. Assume that when price is Rs.20, the quantity demanded is 15 units and when price is Rs.18, the quantity demanded is 16 units. Based on this information what is the marginal revenue resulting from an increase in output from 15 units to 16 units?
(a) Rs. 18 (b) Rs.16 (c) Rs.12 (d) Rs. 28
Answer: (c)
Question 3. Marginal Revenue is equal to:
(a) The change in price divided by the change in output.
(b) The change in quantity divided by the change in price.
(c) The change in P * Q due to a one unit change in output.
(d) Price, but only if the firm is a price searcher.
Answer: (c)
Question 4. Total revenue =
(a) Price x quantity (b) Price x income
(c) Income x quantity
(d) None of these.
Answer: (a)
Class 12 Micro Economics Chapter 9 Producer Equilibrium
Question 1. What conditions must hold if a profit- maximizing firm produces positive output in a competitive market?
Or [6 Marks]
Explain the producer’s equilibrium with MR/MC approach (when Price remains constant with the rise in output).
Or
Explain the conditions of a producer’s equilibrium in terms of marginal cost and marginal revenue. Use diagram
[CBSE Sample Paper 2012, 13] Or
Why is the equality between marginal cost and marginal revenue necessary for a firm to be in equilibrium? Is it sufficient to ensure equilibrium? Explain. [CBSE 2015}
Or
Elaborate the implication of the conditions of equilibrium of a firm.
[CBSE Sample Paper 2016]
Answer: The conditions must hold if a profit maximizing firm produces positive output in a competitive market when price is constant’under MR/MC approach is determined where,
(i) MR = MC (ii) MC must be rising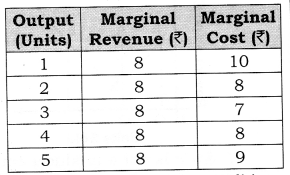
According to Table, both the conditions of equilibrium are satisfied at 4 units of output. MC is equal to MR and MC is rising. MC is more than MR when output is produced after 4 units of output. So, Producer’s Equilibrium will be achieved at 4 units of output. However, MR is equal to MC at 2 units of output also. But, second condition is not fulfilled here.
Let us understand the determination of equilibrium with the help of a diagram: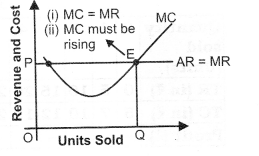
Producer’s Equilibrium is determined at OQ level of output corresponding to point E as at this point, MC = MR and MC curve cuts MR curve from below. In Figure, output is shown on the horizontal axis and revenue and costs on the vertical axis. Producer’s equilibrium will be determined at OQ level of output corresponding to point E because at this, the following two conditions are met:
(i) MC = MR;
(ii) MC curve cuts the MR curve from below.
When MR > MC, then producer will continue to produce as long as MR becomes equal to MC. It is so because firm will find it profitable to raise the output level.
When MR < MC, then producer will cut down the production as long as MR becomes equal to MC. It is so because firm will find it unprofitable to produce an extra unit. So, it starts reducing the level of output till MR = MC.
Question 2. Can there be a positive level of output that a profit-maximizing firm produces in a competitive market at which market price is not equal to marginal cost? Give an explanation. [NCERT on Page 66][6 Marks] Or
Explain why will a producer not be in equilibrium if the conditions of equilibrium are not met. [AI 2015]
Answer: The profit maximizing level of output is always determined where,
(i) MR = MC
(ii) MC must be rising. In other words, where price is equal to MC.
If price is not equal to MC, profit maximizing condition cannot hold. It can be explained with the help of the following two cases:
Case 1: Price Greater Than MC
(i) In the given figure at output level q2, the market price is greater than marginal cost.
(ii) To show that q2 is not a profit maximizing level of output, we have taken q3 output level, which is right of qr
(iii) Suppose the firm increases its output level from q2 to qr The increase in total revenue of the firm from this output is the market price multiplied by the change in quantity (ATR = market price x AQ), that is, the area of rectangle q2q3CB.
(iv) On the other hand, the increase in total cost with this, increase in output is the area of the region q2q3XW.
(v) But, a comparison of the two area shows that the firm’s profit is higher when output level is q3 rather than q1 So, q2 is not a profit maximizing level of output.
Case 2: Price Less Than MC
(i) In the given figure at output level q2, the market price is less than marginal cost.
(ii) To show that q2 is not a profit maximizing level of output, we have taken q3 output level, which is left of qr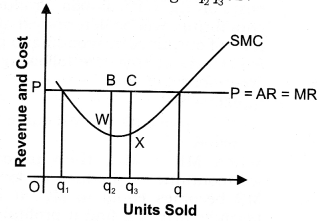
(iii) Suppose now, that the firm reduce its output level from q2 to q1 The decrease in total revenue of the firm from this output is the market price multiplied by the change in quantity (ATR = market price x AQ), that is, the area of rectangle q2q3CB.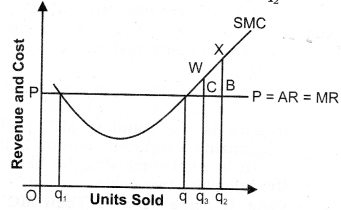
(iv) On the other hand, the decrease in total cost with this decrease in output is the area of the region q2q3WX.
(v) But, a comparison of the two area shows, that by reducing the output from q2 to q3, the decrease in cost is more than the loss in revenue. So, q2 is not a profit maximizing level of output.
Question 3. Will a profit-maximizing firm in a competitive market ever produce a positive level of output in the range where the marginal cost is falling? Give an explanation.
[3-4 Marks]
Answer: No, as sufficient condition of producer equilibrium is Marginal Cost must be rising when Marginal Cost = Marginal revenue. It can be explained with the help of following diagram: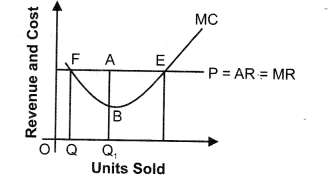
Point F is not a producer equilibrium because at this point, marginal cost = marginal revenue when marginal cost is falling. It is so because after point F, and output then producer will continue to produce as long as MR becomes equal to MC as firm will find it profitable to raise the output level.
Question 4. The following table shows the total revenue and total cost schedules of a competitive firm. Calculate the profit at each output level. Determine also the market price of the goods. [3-4 Marks]
Answer: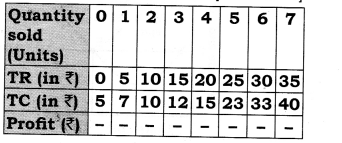
Market price (AR) = TR/Quantity sold = Rs. 5. (TR = Total Revenue; TC = Total Cost)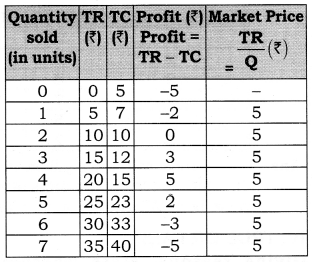
Question 5. The following table shows the total cost schedule of a competitive firm. It is given that the price of the goods is Rs. 10. Calculate the profit at each output level. Find the profit maximising level of output.
Answer: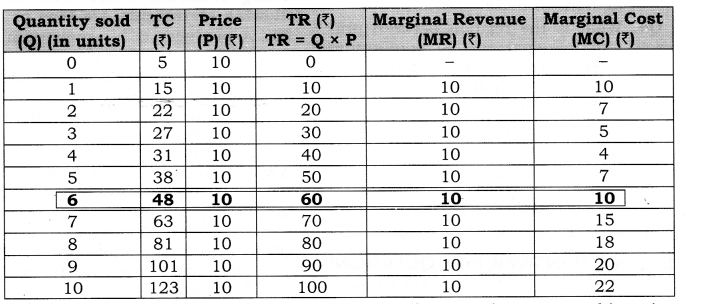
The producer achieves equilibrium at 6 units of output because at this point MC = MR and MC is rising.
MORE QUESTIONS SOLVED
I. Very Short Answer Type Questions (1 Mark)
Question 1. What is meant by profit?
Answer: Profit refers to the excess of revenue over cost.
Question 2. What are the two methods for determination of producer’s equilibrium?
Answer: (i) TR – TC Approach
(ii) MR – MC Approach
Question 3. Explain the producer’s equilibrium. Or
Give meaning of producer’s equilibrium. [CBSE2004C, 05, 07C, 11, 11C;AI05, 08, 11}
Answer: A producer is said to be in equilibrium when he produces that level of output at which his profits are maximum.
Producer’s equilibrium is also known as profit maximisation situation.
Question 4. What is the general profit maximising condition for a producer (MR and MC approach)?
Answer: (i) MC = MR; and
(ii) MC curve cuts the MR curve from below (i.e., MC is rising).
II. Multiple Choice Questions (1 Mark)
Question 1. If MC is more than MR at a particular level of output, how will the producer react to maximize the profits—:
(a) Decrease Production
(b) Increase Production
(c) Increase Revenue
(d) None of these
Answer: (a)
Question 2. When MC is equal to MR, while maximizing profit, then
(a) MC must be rising
(b) MC must be falling
(c) MC must be constant
(d) None of these
Answer: (a)
Question 3. What is the relation between price and marginal cost at equilibrium, when price falls with the rise in output.
(a) Price = Marginal Cost
(b) Price > Marginal Cost
(c) Price < Marginal cost
(d) None of these
Answer: (b)
Question 4. What is the relation between price and marginal cost at equilibrium, when price remains constant with the rise in output.
(a) Price = Marginal Cost
(b) Price > Marginal Cost
(c) Price < Marginal cost
(d) None of these
Answer: (a)
III. Short Answer Type Questions (3-4 Marks)
Question 1. What is the relation between Price and MC at equilibrium (when price falls with the rise in output)?
Answer:
- When more output can be sold only by reducing the prices, AR or Price > MR.
- Equilibrium is achieved when MC = MR.
- So, Price is more than MC at the equilibrium level.
Question 2. “MC should be rising at the point of Producer’s Equilibrium”. Comment.
Answer:
- The given statement is correct.
- If MC is falling at the point of equilibrium, it means that it is possible to add to profits by producing more,
- So, MC should be rising at the point of producer’s equilibrium.
Question 3. Find out the maximum profit position of a producer by comparing his MC and MR on the basis of the following data: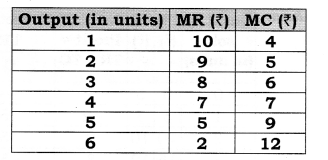
Answer: The producer will be in equilibrium when MR = MC. It occurs at 4 units of output where both MR and MC are equal to 7.
IV. True Or False
Giving reasons, state whether the following statements are true, or false.
Question 1. A producer is in equilibrium when total cost and total revenue are equal.[CBSE, Foreign 2009]
Answer: False: A producer is in equilibrium when difference between total revenue and total cost is maximum so that maximum profit may be earned.
Question 2. If marginal revenue is equal to the total cost, producer is in equilibrium.
Answer: False: Producer is in equilibrium when marginal revenue is equal to marginal cost.
Question 3. A firm is in equilibrium if marginal cost curve cuts average revenue curve from below.
Answer: False: A firm is in equilibrium if marginal cost curve cuts marginal revenue curve from below.
Question 4. A firm gets maximum profits only if difference between average revenue and average cost is the maximum.
Answer: False: A producer is only in equilibrium if difference between total revenue and total cost is maximum.
Note: As per CBSE guidelines, no marks will be given if reason to the answer is not explained.
V. Long Answer Type Questions (6 Marks)
Question 1. Explain the producer’s equilibrium with MR/MC approach (when price falls with the rise in output).
Or
Explain producer’s equilibrium with the help of MC and MR schedules. Use diagram. [CBSE 2010,11 C; AI11]
Or
Why is the equality between marginal cost and marginal revenue necessary for a firm to be in equilibrium? Is it sufficient to ensure equilibrium? Explain. [CBSE 2015]
Answer: When there is no fixed price and price falls with the rise in output, MR curve slope downwards. Producer aims to produce that level of output at which MC is equal to MR and MC curve cuts the MR curve from below. Let us understand this with the help of following table:
According to Table, both the conditions of equilibrium are satisfied at 4 units of output.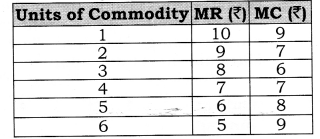
MC is equal to MR and MC is rising. MC is more than MR when output is produced after 4 units of output. So, Producer’s Equilibrium will be achieved at 4 units of output. Let us understand the determination of equilibrium with the help of a diagram: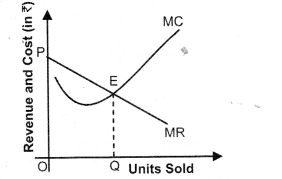
Producer’s Equilibrium is determined at OQ level of output corresponding to point E as at this point, MC = MR and MC curve cuts MR curve from below. In Figure, output is shown on the horizontal axis and revenue and costs on the vertical axis. Producer’s equilibrium will be determined at OQ level of output corresponding to point E because at this, the following two conditions are met:
(i) MC = MR; and
(ii) MC curve cuts the MR curve from below.
When MR > MC, then producer will continue to produce as long as MR becomes equal to MC. It is so because firm will find it profitable to raise the output level.
When MR < MC, then producer will cut down the production as long as MR becomes equal to MC. It is so because firm will find it unprofitable to produce an extra unit. So, it starts reducing the level of output till MR = MC.
So, the producer is at equilibrium at OQ units of output.
Question 2. From the following schedule find out the level of output at which the producer is in equilibrium. Calculate profit. Give reasons for your answer. [CBSE Delhi 2009 (Set-1 &, III)]

The producer achieves equilibrium at 6 units of output. At output levels 5th and 6th unit, the difference between TR and TC, i.e., profit is maximum, which is equal to 5 in both the cases. But the producer is in equilibrium at the 6th unit only where MR = MC (= 24) and MC is rising.
Question 3. On the basis of the information given below, determine the level of output at which the producer will be in equilibrium. Use the marginal cost- marginal revenue approach. Give reasons for your answer.[CBSE Delhi, CBSE Sample Paper 2010]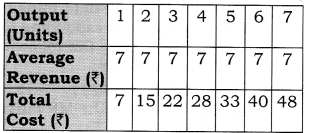
Answer: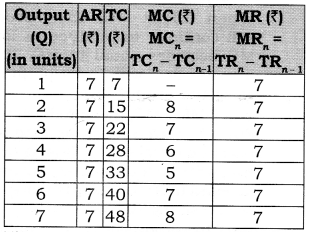
The producer achieves equilibrium at 6 units of output. It is because this level of output satisfies both the conditions of producer’s equilibrium: (i) MC is equal to MR; and (ii) MC becomes greater than MR after this level of output.
Question 4. A table showing TC and TR of a firm is given. Calculate MC and MR and find out the equilibrium level of output.
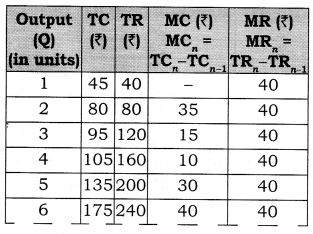
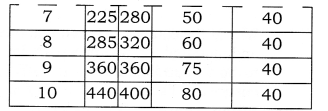
The producer achieves equilibrium at 6 units of output. It is because this level of output satisfies both the conditions of producer’s equilibrium:
(i) MC is equal to MR.
(ii) MC becomes greater than MR after this level of output.
Question 5. Giving reasons identify the equilibrium level of output and find profit at this output using ‘Marginal Cost and Marginal Revenue’ approach from the following?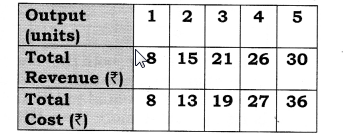
Answer: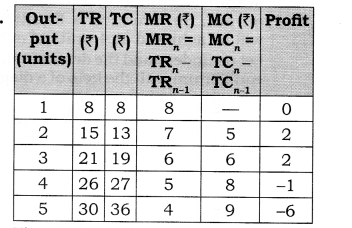
The producer will be at equilibrium at 3 units of output which satisfy both the conditions of producer’s equilibrium, (i) MC= MR (ii) MC must be rising .
Class 12 Micro Economics Perfect Competition
Question 1. What are the Characteristics of a perfectly competitive market? [3 Marks]
Answer:
- Large number of buyers and sellers
- Homogeneous product
- Free entry and exit of firms
- Perfect knowledge about the market
- Perfect mobility of factors of production
- Absence of transportation and selling cost
Question 2. What is price line under perfect competition? [3 Marks]
Answer :
- The price line shows the relationship between the market price and a competitive firm’s output level,
- The vertical height of the price line is equal to the market price as shown in the given figure.
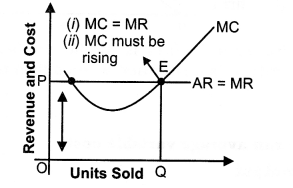
Question 3. What is the relation between market price and average revenue of a price taking firm (i.e. perfectly competitive firm)? [1 Mark]
Answer: The average revenue (AR) of a firm is defined as total revenue per unit of output sold. Let a firm’s output be Q and the market price be P, then TR equals P x Q. Hence,
In other words, for a price-taking firm, average revenue equals the market price.
QUESTIONS SOLVED
I. Very Short Answer Type Questions (1 Mark)
Question 1. Define market for a good. [CBSE 2008]
Answer: Market refers to a region where buyers and sellers of a commodity come in contact with each other to effect the transactions of purchase and sale of the commodity.
Question 2. What are the main forms of market?
Answer: (i) Perfect competition (ii) Imperfect competition.
- Monopoly
- Monopolistic competition
- Oliopolgy.
Question 3. Define perfect competition.
Answer: It refers to a market situation in which buyers and sellers operate freely and a commodity sells at a uniform price.
Question 4. What do you mean by homogenous product?
Answer: Products sold in the market are homogeneous, i.e., they are identical in all respects like quality, colour, size, weight, design, etc
Question 5. In which market forms are average revenue and marginal revenue of a firm always equal? [CBSE, All India 2004]
Answer: Perfect competition.
Question 6. In which market form does a firm face a perfectly elastic demand curve?
Answer: Perfectly competitive market.
Question 7. What induces new firms to enter an industry? [CBSE Sample Paper 2008]
Answer: Abnormal profits, i.e., above normal profits.
Question 8. If the firms are earning abnormal profits how will the ‘number of firms in industry change?
Answer: The number of firms in the industry will increase.
Question 9. In which market form are goods sold at a uniform price?
Answer: Perfect competition.
Question 10. Why are selling costs not incurred in perfect competition?
Answer: Selling costs are not incurred in perfect competition as there exists perfect knowledge among the buyers and sellers.
Question 11. What is meant by the term ‘price – taker ‘ in the context of a firm?
[CBSE, 2008]
Answer: A firm is said to be a price-taker if it has to accept the price, as determined by the market forces of demand and supply.
Question 12. Under which market form a firm is a price-taker? [CBSE 2004]
Answer: Perfect competition.
Question 13. What is a price taker firm? [CBSE 2012]
Answer: A price taker firm is one which has no option but to accept the price as determined by the industry as in perfect competition.
II. Multiple Choice Questions (1 Mark)
Question 1. What is the shape of the demand curve faced by a firm under perfect competition?
(a) Horizontal (b) Vertical
(c) Positively sloped
(d) Negatively sloped
Answer: (a)
Question 2. Which one of the following equations is not a characteristic of a “price taker”?
(a) TR = P x Q (b) AR = Price
(c) Negatively-sloped demand curve
(d) Marginal Revenue = Price
Answer: (c)
Question 3. Which one of the following options is not a condition of perfect competition?
(a) A large number of firms.
(b) Perfect mobility of factors.
(c) Informative advertising to ensure that consumers have good information.
(d) Freedom of entry and exit into and out of the market.
Answer: (c)
Question 4. Under perfect competition a firm is
(a) price maker and not price taker
(b) price taker and not price maker
(c) neither price maker nor price taker
(d) None of these.
Answer: (b)
Question 5. Which one of the following options is not a characteristic of a perfectly competitive market?
(a) Large number of firms in the industry.
(b) Outputs of the firms are perfect substitutes for one another.
(c) Firms face downward-sloping demand curves.
(d) Resources are very mobile.
Answer: (c)
Question 6. Price-taking firms, i.e., firms that operate in a perfectly competitive market are said to be “small” relative to the market. Which one of the following options best describes this smallness?
(a) The individual firm must have fewer than 10 employees.
(b) The individual firm faces a downward-sloping demand curve.
(c) The individual firm has assets of less than Rs 20 lakh.
(d) The individual firm is unable to affect market price through its output decisions.
Answer: (d)
Question 7. For a price-taking firm.
(a) marginal revenue is less than price
(b) marginal revenue is equal to price
(c) marginal revenue is greater than price
(d) the relationship between marginal revenue and price is indeterminate
Answer: (b)
Question 8. The firm in a perfectly competitive market is a price taker. This designation as a price taker is based on the assumption that
(a) the firm has some, but not complete, control over its product price.
(b) there are so many buyers and sellers in the market that any individual firm cannot affect the market.
(c) each firm produces a homogeneous product.
(d) there is easy entry into or exit from the market place.
Answer: (b)
Question 9. Suppose that a sole proprietorship is earning total revenues of Rs 1,00,000 and is incurring explicit costs of Rs 75,000. If the owner could work for another company for Rs 30,000 a year, we would conclude that—————-
(a) the firm is incurring an economic loss.
(b) implicit costs are Rs 25,000.
(c) the total economic costs are Rs 1,00,000.
(d) the individual is earning an economic profit of Rs 25,000.
Answer: (a)
Question 10. A purely competitive firm’s supply schedule in the short run is determined by—————-
(a) its average revenue.
(b) its marginal revenue.
(c) its marginal utility for money curve.
(d) its marginal cost curve.
Answer: (d)
Question 11. The term market’ refers to a——————-
(a) place where buyer and seller bargain a product or service for a price
(b) place where buyer does not bargain
(c) place where seller does not bargain
(d) None of these.
Answer: (a)
III. Short Answer Type Questions (3-4 Marks)
Question 1. Explain feature of homogeneous product. [AI2004, 11; CBSE 07, 09C] Or
Explain the implication of : homogeneous product.
Answer:
- Products sold in the market are homogeneous, i.e., they are identical in all respects like quality, colour, size, weight, design, etc.
- The products sold by different firms in the market are equal in the eyes of the buyers.
- Since, a buyer cannot distinguish between the product of one firm and that of another, he becomes indifferent as to the firms from which he buys.
- The implication of this feature is that since the buyers treat the products as identical they are not ready to pay a different price for the product of any one firm. They will pay the same price for the products of all the firms in the industry. On the other hand, any attempt by a firm to sell its product at a higher price will fail.
To sum up, the “homogeneous products” feature ensures a uniform price for the products of all the firms in the industry.
Question 2. “In perfect competition, industry is the price maker and firm is the price taker.” Discuss.
Answer: Yes, this statement is true.
- As we know, in Perfect competition, homogeneous goods are produced. So, industry cannot charge different price from different firms.
- So, industry will give that price to the firm where industry is in equilibrium, i.e., where Demand = Supply. Any movement from that point would be unstable.
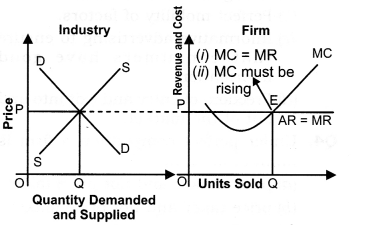
- In the given diagram, price and revenue is measured on vertical axis and units of commodity on horizontal axis. Industry will give OP price or point E to the firm as at that point Demand = supply, i.e., industry is in equilibrium. The firms will follow the same price and charges same from the consumer.
Question 3. Explain features of perfect knowledge about the market.
Answer:
- Perfect Knowledge means both buyers and sellers are fully informed about the market.
- The firms have all the knowledge about the product market and the input markets. Buyers also have perfect knowledge about the product market.
- Let us first take the product market. The implication of perfect knowledge about the product market is that any attempt by any firm to charge a price higher than the prevailing uniform price will fail. The buyers will not pay because they have perfect knowledge. A uniform price prevails in the market.
- Regarding the knowledge about the input markets the implicit assumption is that each firm has an equal access to the technology and the inputs used in the technology.
- No firm has any cost advantage. Cost structure of each firm is the same.
- Since there is uniform price and uniform cost in case of all firms, and since profit equals revenue less cost, all the firms earn uniform profits.
Question 4. What is the relationship between TR, AR and MR under perfect competition?
Answer:
- In the perfect competition, a firm is a price taker.
- It has to sell its product at the same price as given (determined) by the industry. Consequently, price = AR = MR.
- Hence, a firm’s AR and MR curve will be a horizontal straight line parallel to X axis.
- Since price remains the same, i.e., MR is constant, therefore, TR increases at the Constant rate as increase in the output sold.
- As the result of, TR curve facing a competitive firm is positively sloped straight line. Again, because at zero output Total Revenue is zero therefore, TR curve passes through the origin O as shown in the given figure.
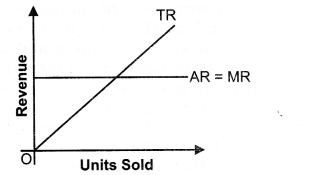
Question 5. Why is AR curve of a firm under perfect competition parallel to X-axis? [CBSE 2006]
Answer:
- AR curve of a firm under perfect competition is parallel to X-axis because in perfect competition homogeneous product are produced, that is why price remains constant and as we know AR = TR/Q = PX Q/Q = Price. So, AR remains constant.
- As, AR is on Y-axis, that is why AR curve remains constant and parallel to X-axis.
Question 6. There are large number of sellers in a perfectly competitive market. Explain the significance of this feature. [CBSE 2015]
Answer: Large number of sellers—:
- The words large number’ simply states that the number of sellers is large enough to render a single seller’s share in total market supply of the product insignificant,
- Insignificant share means that if only one individual firm reduces or raises its own supply, the prevailing market price remains unaffected.
- The prevailing market price is the one which was set through the intersection of market demand and market supply forces, for which all the sellers and all the buyers together are responsible. (iv) One single seller has no option but to sell what it produces at this market determined price. This position of an individual firm in the total market is referred to as price taker. This is a unique feature of a perfectly competitive market.
IV. True Or False
Giving reasons, state whether the following statements are true or false.
Question 1. In perfect competition, a firm independently determines price.
Answer: False: In perfect competition, a firm is only price taker and industry is price maker.
Question 2. In perfect competition every firm of the industry is price maker.
Answer: False: In perfect competition, every firm is a price taker.
Question 3. Under perfect competition, all the units of a good produced can be heterogeneous.
Answer: False: Under perfect competition, all the units of a good produced are homogeneous.
Question 4. The condition for shut down point is, the price is equal to minimum of short run average cost.
Answer: False: It is so because the condition for shut down point is the price equal to minimum of short run average variable cost.
Question 5. In perfect competition, selling costs can help in raising sale of the product.
Answer: False: Under perfect competition, as the units of a good are homogeneous and are sold at the same price.
Question 6. Rising portion of MC curve is a supply curve of a competitive firm.
Answer: False: Supply curve is that part of rising MC curve which would be greater than or equal to minimum of short run average variable cost.
Note: As per CBSE guidelines, no marks will be given if reason to the answer is not explained.
V. Long Answer Type Questions (6 Marks)
Question 1. Explain feature (implication) of ‘large number of sellers and buyers’ in perfect competition. [CBSE 2005C, 10, IOC, 11C; AI 08, 10, 11, 13] Or
Explain the implications of large number of sellers in a perfectly competitive market.
Or [AI 2012]
Explain the implications of large number of buyers in a perfectly competitive market. [CBSE 2012]
Answer: Large number of sellers—:
- The words ‘large number’ simply states that the number of sellers is large enough to render a single seller’s share in total market supply of the product insignificant.
- Insignificant share means that if only one individual firm reduces or raises its own supply, the prevailing market price remains unaffected.
- The prevailing market price is the one which was set through the intersection of market demand and market supply forces, for which all the sellers and all the buyers together are responsible. (iv) One single seller has no option but to sell what it produces at this market determined price. This position of an individual firm in the total market is referred to as price taker. This is a unique feature of a perfectly competitive market.
Large number of buyers—:
- The words ‘large number’ simply states that the number of buyers is large enough, that an individual buyer’s share in total market demand is insignificant, the buyers cannot influence the market price on his own by changing his demand.
- This makes a single buyer also a price taker.
To sum up, the feature “large number” indicates ineffectiveness of a single seller or a single buyer in influencing the prevailing market price on its own, rendering him simply a price taker.
Question 2. Explain the features of free entry and exit of firms.
[CBSE 2004, 07, 09C] Or
Explain the outcome of the following features of a perfectly competitive market:
[CBSE 2013C, CBSE Sample Paper 2014]
- Freedom to firms to enter the industry.
- Freedom to the firms to leave the industry.
Answer:
- Buyers and sellers are free to enter or leave the market at any time
they like. New firms induced by large profits can enter the industry whereas losses make inefficient firms to leave the industry. - The freedom of entry and exit of firms has an important implication. This ensures that no firm can earn above normal profit in the long run. Each firm earns just the normal profit, i.e., minimum necessary to carry on business.
- Suppose the existing firms are earning above normal profits, i.e. positive economic profits. Attracted by the positive profits, the new firms enter the industry. The industry’s output, i.e. market supply, goes up. The prices come down. New firms continue to enter and the prices continue to fall till economic profits are reduced to zero.
- Now suppose the existing firms .are incurring losses. The firms start leaving. The industry’s output starts falling, prices going up, and all this continues till losses are wiped out. The remaining firms in the industry then once again earn just the normal profits.
- Only zero economic profit in the long run is the basic outcome of a perfectly competitive market.
VI. Higher Order Thinking Skills
Question 1. What are the conditions for short run shut down point? [1 Mark]
Answer: Price = minimum of SAVC (short run average variable cost)
Or TR = TVC
Question 2. A perfectly competitive firm faces market price equal to Rs 15. [3-4 Marks]
(i) Derive its total revenue schedule for the range of output from 0 to 10 units.
(ii) Suppose the market price increases to 17. Will the new TR curve be flatter or steeper?
Answer:
VII.Value Based Questions
Question 1. What is a competitive market? Briefly describe a type of market that is not perfectly competitive. [3 Marks]
Answer:
- A competitive market is a market in which there are many buyers and many sellers of an identical product so that each has a negligible impact on the market price.
- Another type of market is a monopoly in which there is only one seller.
- There are also other markets that fall between perfect competition and monopoly i.e. monopolistic competition.
Value: Analytic
Question 2. What is the relationship between a perfectly competitive firm’s marginal cost curve and its short-run supply curve? [ 1 Mark]
Answer: The marginal cost curve of a perfectly competitive firm is the firm’s short- run supply curve at the point where price is equal to or greater than average variable cost. To determine its quantity supplied the firm equates the price of its product with its marginal cost.
Value: Analytic
VIII.Application Based Question
Question 1. “The rising portion of the SMC curve is the firm supply curve of competitive firm”. Explain.
Or
Explain the short run supply curve of the firm. [6 Marks]
Or
‘Supply curve is the rising portion of marginal cost curve over and above the minimum of Average Variable cost curve’. Do you agree? Support your answer with valid reason. [CBSE Sample Paper 2016]
Answer:
- The supply curve of the firm tells us the quantity of the product that a firm is willing and able to produce and sell at each possible price.
- The firm will produce and supply an output at the point at which Price is equal to Marginal cost. The derivation of the supply curve is explained with the help of the given figure.
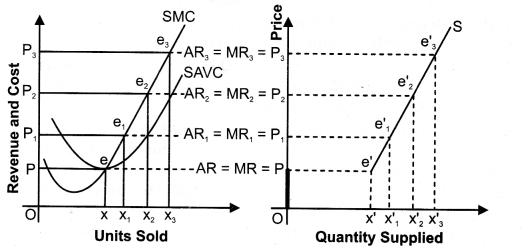
- The SMC of the firm is given. Let us initially assume that the market price is OP1 . The firm will produce and supply an output of OX1 because at e1, price = MC. (OX1 is the equilibrium output supplied, as MC = MR and MC cuts MR from below).
- Suppose the market price rises to OP2, then the firm will produce and sell OX2 level, because at e2 level price = MC = MR.
- Similarly, as market price increases to OP3, quantity supplied increases to OX3. However, the firm will not supply any quantity if the price falls below OP.
- At OP price, the firm will produce and sell OX output. For any price below OP the firm will not produce and sell anything. The supply will be zero units. Having the above information, the supply schedule can be determined as,
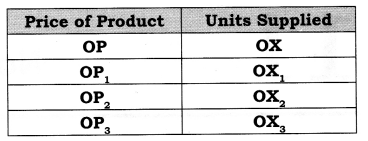
- If the market price falls below the minimum of the SAVC, the supply curve jumps to the small segment (OP) on the vertical axis at which there is zero supply. Therefore, two discontinuous [(OP) + (e’S)] pieces define the short run supply curve for the perfectly competitive firm.
Very Short Answer Type Questions (1 Mark)
Question 1. Define monopoly. [CBSE 2005, 09]
Answer: ‘Mono’ means single and ‘poly’ means seller, i.e., single seller. Monopoly is a market situation where there is a single firm selling the commodity and there is no close substitute of the commodity sold by the monopolist.
Question 2. Under which market form, firm is a price-maker?
Answer: Monopoly.
Question 3. What are the shapes of AR and MR curves under monopoly?
Answer: Both AR and MR curves slope downward s. ‘
Question 4. How many firms are there in a monopoly market?
Answer: One firm.
Question 5. What is a price-maker firm? [AI 2012]
Answer: A price maker firm is one to fix the price itself because of its monopoly power.
Question 6. What does Monopolistic Competition mean?
Answer: It refers to a market situation in which there are many firms which sell closely related but differentiated products.
Question 7. Why is the demand curve under monopoly less elastic as compared to the demand curve under monopolistic competition?
Answer: Demand curve under monopoly is less elastic as compared to the demand curve under monopolistic competition due to absence of close substitutes in monopoly.
Question 8. Define product differentiation.
Answer: Product differentiation refers to differentiating the products on the : basis of brand, size, colour, shape, etc.
Question 9. In which form of market there is product differentiation? [CBSE 2005]
Answer: Monopolistic competition.
Question 10. Give the meaning of ‘Oligopoly’. [CBSE, Sample Paper 2010]
Answer: Oligopoly is a market situation in which an industry has only a few firms (or few large firms producing most of its output) mutually dependent for taking decisions about price and output.
II. Multiple Choice Questions (1 Mark)
Question 1. Which one of the following statement is not a characteristic of monopolistic competition?
(a) Ease of entry into the industry.
(b) Product differentiation.
(c) A relatively large number of sellers.
(d) A homogenous product.
Answer: (d)
Question 2. All of the following are characteristics of a monopoly except:———————–.
(a) There is a single firm.
(b) The firm is a price-taker.
(c) The firm produces a unique product.
(d) The existence of some advertising.
Answer: (b)
Question 3. Oligopolistic industries are characterized by—
(a) A few dominant firms and substantial barriers to entry.
(b) A few large firms and no entry barriers.
(c) A large number of small firms and no entry barriers.
(d) One dominant firm and low entry barriers.
Answer: (a)
Question 4. Monopolistic competition differs from perfect competition primarily becaus—
(a) in monopolistic competition firms can differentiate their products.
(b) in perfect competition firms can differentiate their products.
(c) in monopolistic competition entry into the industry is blocked.
(d) in monopolistic competition there are relatively few barriers to entry.
Answer: (a)
12. Give an example of a person who is staying abroad for a period more than one year and still he is treated as normal resident of India.
Ans: An Indian working in Indian Embassy in the USA will be treated as normal resident of India.
II. MULTIPLE CHOICE QUESTIONS (1 Mark)
1. Transfer payments refer to payments which are made:
(a) Without any exchange of goods and services.
(b) To workers on transfer from one job to another.
(c) As compensation to employees.
(d) None of these
Ans: (a)
2. Which one of the following items comes under consumption goods?
(a) Durable goods
(b) Semi-durable goods
(c) Non-durable goods
(d) All of these.
Ans: (d)
3. Service of a teacher:
(a) Capital goods
(b) Consumption goods
(c) Intermediate goods
(d) Can be Consumption goods and intermediate goods
Ans: (d)
4. In a circular flow of income, we have:
(a) Production (b) Distribution
(c) Disposition (d) All of them
Ans: (d)
5. Who is considered as agents of factor
of production,
(a) Households
(b) Government
(c) Rest of the world
(d) All of these
Ans: (a)
6. Which among the following are the
features of capitalist economy,
(a) Private ownership of Land and Capital.
(b) Profit is the only motive.
(c) Free Play of market forces of demand and supply.
(d) All of these
Ans: (d)
7. Flow of Goods & services and factors of production across different sectors in a barter economy is known as: [CBSE Sample Paper 2016]
(a) Circular flow (b) Real flow
(c) Monetary Flow (d) Capital Flow
Ans: (b)
III. SHORT ANSWER-TYPE QUESTIONS
1. Explain the basis of classifying goods into intermediate and final goods. Give suitable examples. Or [CBSE 2010]
Distinguish between intermediate products and final products. Give examples. ‘ [CBSE 2009]
Ans: 

2. Define consumption goods and what are its categories.
Ans: Consumption goods are those which satisfy the wants of the consumers directly.
For example, cars, television sets, bread, furniture, air-conditioners, etc. Consumption goods can further be subdivided into the following categories:
- Durable goods: These goods have an expected life time of several years and of relatively high value. They are motor cars, refrigerators, television sets, washing machines, air-conditioners, kitchen equipments, computers, communication equipments etc.
- Semi-durable goods: These goods have an expected life time of use of one year or slightly more. They are not of relatively great value. Examples are clothing, furniture, electrical appliances like fans, electric irons, hot plates and crockery.
- Non-durable goods: Goods which cannot be used again and again, i.e., they lose their identity in a single act of consumption are known as non durable goods. These are food grains, milk and milk products, edible oils, beverages, vegetables, tobacco and other food articles.
goods which satisfy the human wants directly. They cannot be seen or touched, i.e., they are intangible in nature. These are medical care, transport and communications, education, domestic services rendered by hired servants, etc.
3. Define capital goods and its categories.
Or
Define ‘capital goods’.[CBSE Foreign 2011]
Ans:
- Capital goods are defined as all goods produced for use in future productive processes.
- For example, All the durable goods like cars, trucks, refrigerators, buildings, air crafts, air-fields and submarines used to produce goods and services for sale in the market are a part of capital goods.
- Stocks of raw materials, semi finished and finished goods lying with the producers at the end of an accounting year are also a part of capital goods.
- Some more examples of capital goods are machinery, equipment, roads and bridges.
- These goods require repair or replacement over time as their value depreciate over a period of time.
4. Distinguish between consumption goods and capital goods. Which of these are final goods? [CBSE Delhi 2010]
Ans: 

5. Differentiate between Current transfers and Capital Transfers.
Ans: 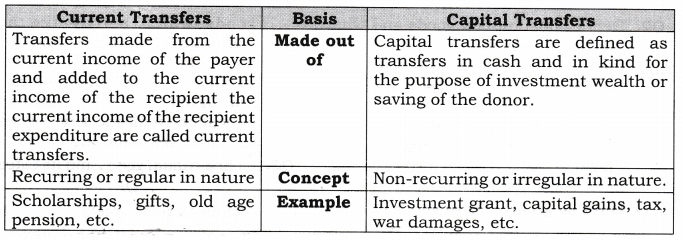
IV. GIVE REASONS
A. Giving reasons, classify the following into intermediate or final goods.
1. Machines purchased by a dealer of machines. [CBSE (AZ) 2010]
Ans: Intermediate good
Reason: Machines purchased by a dealer of machines is an intermediate good because machines are resold by the firms to make profits or value is yet to be added to these goods by way of further processing.
2. A car purchased by a household.[CBSE (AI) 2010]
Ans: Final good
Reason: A car purchased by a household is a final good because the household is the final user of the car and no value is to be added to the car.
3. Furniture purchased by a school. [CBSE Delhi 2011]
Ans: Final good
Reason: Furniture purchased by a school is a final product because school is the final user of the furniture and no value is to be added to the furniture. This will be deemed as investment expenditure because furniture is used by the school for several years and is of high value.
4. Chalks, dusters, etc. purchased by a school. [CBSE Delhi 2011]
Ans: Intermediate good
Reason: Chalks, dusters, etc. purchased by a school are intermediate goods as these are used up in the process of value – addition during the year.
5. Computers installed in an office.[CBSE Delhi 2011]
Ans: Final good
Reason: Computers installed in an office is a final product because computers are finally and repeatedly used by the office for several years and these are of high value.
6. Mobile sets purchased by a mobile dealer. [CBSE Delhi 2011]
Ans: Intermediate product
Reason: Mobile sets purchased by a mobile dealer is an intermediate product because these are purchased for resale.
7. Expenditure on maintenance of an office building. [CBSE Delhi 2011]
Ans: Intermediate product
Reason: Expenditure on maintenance of an office building is an intermediate expenditure as the things purchased for repair and maintenance are used up during the period of one year.
8. Expenditure on improvement of a machine in a factory.[CBSE Delhi 2011]
Ans: Final Product
Reason: Expenditure on improvement of a machine in a factory is a final expenditure as the machine is repeatedly used for several years as a fixed asset. Improvement of a machine implies improvement of asset value (through investment expenditure).
9. Purchase of furniture by a firm.[CBSE (Al) 2010]
Ans: Final Product
Reason: Purchase of furniture by a firm is a final expenditure because furniture is repeatedly used by the firm for several years and this is of high value.
10. Expenditure on maintenance by a firm. [CBSE (AI) 2010]
Ans: Intermediate product
Reason: Expenditure on maintenance by a firm is an intermediate expenditure as the things purchased for repair and maintenance are used up during the period of one year.
11. Paper purchased by a publisher.
Ans: Intermediate product
Reason: It is an intermediate product as paper is used for further production during the same year.
12. Milk purchased by households.
Ans: Final product
Reason: It is a final product as it is used by households for final consumption.
13. Purchase of rice by a grocery shop.
Ans: Intermediate product
Reason: These are intermediate products because these are purchased for resale.
14. Coal used by manufacturing firms.
Ans: Intermediate product
Reason: It is an intermediate product as coal is used for further production during the same year.
15. Coal used by consumer households.
Ans: Final product
Reason: It is a final product as it is used by households for final consumption.
16. Purchase of pulses by a consumer.
Ans: Final Product
Reason: It is a final product as it is used by a consumer for final consumption.
17. Fertilizers used by the farmers.
Ans: Intermediate product
Reason: These are intermediate products because fertilizer is used for further production during the same year.
18. Printer purchased by a lawyer.
Ans: Final product
Reason: It is a final product because it is purchased for investment.
19. Wheat used by the flour mill.
Ans: Intermediate product
Reason: It is an intermediate product as wheat is used for further production during the same year or is meant for resale.
20. Unsold coal with trader at a year end.
Ans: Final product
Reason: It is a final product as the unsold coal is an investment for the trader.
21. Cotton used by a cloth mill.
Ans: Intermediate product
Reason: It is an intermediate product as cotton is used for further production during the same year.
22. Wheat used by households.
Ans: Final product
Reason: It is a final product as it is used by households for final consumption.
23. Refrigerator installed by a firm.
Ans: Final product
Reason: It is a final product because it is purchased for investment.
24. Sugar used by a sweet shop.
Ans: Intermediate product
Reason: It is an intermediate product as sugar is used for further production during the same year.
B. Giving reasons, classify the following into factor income or transfer income.
1. Unemployment allowances.
Ans: Transfer income
Reason: It is received without rendering any productive services.
2. Salary received by Pankaj from a company.
Ans: Factor income
Reason: It is earned by rendering productive services.
3. Financial help to earthquake victims.
Ans: Transfer income
Reason: It is received without rendering any productive services.
4. Compensation received from the employer.
Ans: Factor income
Reason: It is earned by rendering productive services.
5. Claim received from Insurance company by an injured worker.
Ans: Transfer income
Reason: It is received without rendering any productive services.
6. Birthday gift received from a friend.
Ans: Transfer income
Reason: It is received without rendering any productive services.
7. Bonus received on Diwali.
Ans: Factor income
Reason: It is earned by rendering productive services.
C. Giving reasons, classify the following into stock or flow.
1. Capital [GBSE 2013]
Ans: Stock concept
Reason: Capital is stock because it is measured at a point of time.
2. Saving [CBSE 2013]
Ans: Flow concept
Reason: Saving is flow because it is .measured during a period of time.
3. Gross Domestic Product [CBSE 2013]
Ans: Flow concept
Reason: Gross domestic product is a flow because it is measured during a period of time.
4. Wealth [CBSE 2013]
Ans: Stock concept
Reason: Wealth is stock because it is measured at a point of time.
5. Exports
Ans: Flow concept
Reason: It relates to a period of time.
6. Imports
Ans: Flow concept
Reason: It relates to a period of time.
7. Business capital of business
Ans: Stock concept
Reason: It is related to a point of time.
8. Investment
Ans: Flow concept
Reason: It relates to a period of time.
9. Foreign Investment
Ans: Flow concept
Reason: It relates to a period of time.
10. Foreign Assets
Ans: Stock concept
Reason: It relates to a point of time.
11. Foreign Remittances (In flow of money)
Ans: Flow concept
Reason: It is related to a period of time.
12. Production of Wheat
Ans: Flow concept
Reason: It is related to a period of time.
13. Income of a servant
Ans: Flow concept
Reason: It is related to a period of one month or one year.
14. Budget Expenditure
Ans: Flow concept
Reason: It is related to a period of time. (1 year)
15. Money supply
Ans: Stock concept
Reason: It relates to a particular point of time.
16. Machinery of a firm
Ans: Stock concept
Reason: It relates to a point of time.
17. A five hundred rupee note
Ans: Stock concept
Reason: It is related to a point of time.
D. Giving reasons state whether the following are included or excluded in/from domestic territory.
1. An Indian Company in America
Ans: Excluded
Reason: As it is outside the domestic territory of our country.
2. Microsoft Office in India
Ans: Included
Reason: As it is within the domestic territory of our country.
3. Company in India owned by an American
Ans: Included
Reason: As it is within the domestic territory of our country.
4. Office of Tata in New York
Ans: Excluded
Reason: As it is outside the domestic territory of our country.
5. Branch of Foreign Bank in India
Ans: Included
Reason: As it is within the domestic territory of our country.
6. Indian Embassy in China
Ans: Included
Reason: As it is within the domestic territory of our country.
7. Branch of Punjab National Bank in America
Ans: Excluded
Reason: As it is outside the domestic territory of our country.
8. Russian Embassy in India
Ans: Excluded
Reason: As it is outside the domestic territory of our country.
9. Reliance Industries rented its building to Microsoft in America.
Ans: Excluded
Reason: As it is outside the domestic territory of our country.
E. Classify the following into durable, non-durable, semi-durable or services
1. Refrigerator
Ans: Durable
Reason: As it has expected life time of several years and of relatively high value.
2. Clothes
Ans: Semi-durable
Reason: As it have an expected life time of use of one year or slightly more.
3. Edible oil
Ans: Non-durable
Reason: As it loose their identity in a single act of consumption.
4. Tuition given by a teacher
Ans: Service
Reason: As it is non-material goods which satisfy the human wants directly.
5. Visit of a physician
Ans: Service
Reason: As it is non-material goods which satisfy the human wants directly.
6. Washing soaps
Ans: Non-durable
Reason: As it loose their identity in a single act of consumption.
F. Classify the following into consumer, intermediate or capital goods.
1. Milk used by a manufacturer of sweets.
Ans: Intermediate goods
Reason: As it is used up while making sweets.
2. Cycle purchased by a consumer household
Ans: Consumer goods
Reason: End user is consumer.
3. Textile machinery
Ans: Capital goods
Reason: End user is producer.
4. Construction of a house
Ans: Consumer goods
Reason: End user is consumer.
5. Bread and butter used by a consumer household.
Ans: Consumer goods
Reason: End user is consumer.
6. Services of a private doctor purchased by a consumer household.
Ans: Consumer goods
Reason: End user is consumer.
7. Fertilizer used by a farmer.
Ans: Intermediate goods
Reason: As fertilizer is used for further production during the same year.
8. Passenger bus service used by a consumer household.
Ans: Consumer services
Reason: End user is consumer.
G. Giving reasons, classify the following into normal resident of India or not.
1. Indian officials working in the Indian Embassy in USA.
Ans: Normal Resident
Reason: As their centre of economic interest lies in the home country.
2. A Japanese tourist who stays in India for 2 months.
Ans: Not a Normal Resident
Reason: As their centre of economic interest lies in the foreign country.
3. Indians going to Pakistan for watching the cricket match.
Ans: Normal Resident
Reason: As their centre of economic interest lies in the home country.
4. Indians working in the UNO office, located in America for less than 1 year.
Ans: Normal Resident
Reason: As their centre of economic interest lies in the home country.
5. Indian employees working in WHO, located in India.
Ans: Normal Resident
Reason: As their centre of economic interest lies in the home country.
6. Foreign tourists visiting India for a month to see the Taj Mahal.
Ans: Not a Normal Resident
Reason: As their centre of economic interest lies in the foreign country.
V. TRUE OR FALSE
Giving reasons, state whether the following statements are true or false.
1. Macroeconomics deals with the problems of a consumer.
Ans: False: It deals with problems of the economy.
2. Money flow is also known as physical flow.
Ans: False: Real flow is known as physical flow. Money flow is known by the name of nominal flow.
3. In a two-sector economy, total production is always equal to total consumption.
Ans: True: It happens because firms sell their entire output to the households.
4. Circular flow of income takes place in case of open economy and close economy.
Ans: True: Even in case of closed economy, circular flow of income takes place between households and firms.
5. Capital formation is a flow.[CBSE Sample Paper 2010]
Ans: True: Capital formation is measured over a period of time
6. Foreign remittances are a stock concept.
Ans: False: It is flow concept as these are assessed over a period of time and not at a point of time.
7. National Income of a country- is a stock concept.
Ans: False: It is a flow concept as it is measured over a period of time.
8. Bread is always a consumer good.[CBSE Sample Paper 2010]
Ans: False: It depends on the use of bread. When it is purchased by a household, it is a consumer good. If it is purchased by a restaurant, it is a producer intermediate goods.
9. Television is a capital good.
Ans: False: Television is a durable consumption good.
10. Services of a teacher is a consumption good.
Ans: True: It directly satisfies human wants.
11. Books in a library are intermediate goods.
Ans: False: Books used in a library are final goods as these are used by the end user.
12. Use of raw material is a consumption good.
Ans: False: Use of raw material helps in production process therefore it is a single use producer good. But it has no longer life.
13. Can purchase of a new car be categorized as an intermediate good.
Ans: True: Purchase of a new car can be categorized as an intermediate good, if purchased by a Government for military use or if it is purchased by a car dealer for resale.
14. A good can be an intermediate goods in one case and a final goods in another case.
Ans: True: A good can be an intermediate goods or final goods, depending upon its nature of use. For example, a car purchased by a household is a final good, whereas, it will be an intermediate good if it is purchased by a car dealer.
15. The concept of normal resident applies to individuals only.
Ans: False: The concept applies to institutions also, in addition to individuals.
16. In final goods, no value is to be added.
Ans: True: Because final goods have crossed the production boundary.
17. Transfer income is a part of factor income.
Ans: False: It is not a factor income, It is paid for without receiving any goods and services.
VI. HIGHER ORDER THINKING SKILLS
1. Explain that Domestic territory is bigger than the political frontiers of a country.
Ans: In layman terms, the domestic territory of a nation is understood to be the territory lying within the political frontiers (or boundaries) of a country. But in national income accounting, the term domestic territory is used in a wider sense. Based on ‘freedom’ criterion, the scope of economic territory is defined to cover:
- Ships and air crafts owned and operated by normal residents between two or more countries. For example, Indian Ships moving between China and India regularly are part of domestic territory of India. Similarly, planes operated by Air India between Russia and Japan are part of the domestic territory of India. Similarly, planes operated by Malaysian Airlines between India and Japan are a part of the domestic territory of Malaysia.
- Fishing vessels, oil and natural gas rigs and floating platforms operated by the residents of a country in the international waters where they have exclusive rights of operation. For example, Fishing boats operated by Indian fishermen in international waters of Indian Ocean will be considered a part of domestic territory of India.
- Embassies, consulates and military establishments of a country located abroad. For example, Indian Embassy in Russia is a part of the domestic territory of India.
‘Consulate’ is an office or building used by consul (an officer commissioned by the government to reside in a foreign country to promote the interest of the country to which he belongs).
2. “All Producer Goods are not Capital Goods”. Explain.
Ans: Producer goods are all those goods which are used in the process of production i.e., which are used in the production of other goods. Producer goods include two types of goods:
- Single-use Producer Goods: Goods used as raw material by the producers. It includes raw material like coal, wood, etc. They are not capital goods as they cannot be repeatedly used in the production process.
- Capital Goods: Goods which are used as fixed assets by the producers, like plant and machinery, which can be repeatedly used in the production process.
So, it can be said that all capital goods are producer goods, but all producer goods are not capital goods.
3. “Machine purchased is always a final good.” Do you agree? Give reasons for your answer.
Ans: No, it is not necessary that machine purchased is a final good. It will depend upon its use.
- If a machine is purchased by a household, then it is a final good. For example, washing machine purchased by a consumer household is a final goods.
- If it is purchased by a firm for its own use, then it is also a final good. For example, refrigerator purchased by a firm.
- If it is bought by a firm for resale, then it is an intermediate good. For example, machine purchased by a machine dealer.
4. “ Machine purchased is always a capital good.” Do you agree? Give reasons for your answer.
Ans: No, it is not necessary that machine purchased is a capital good. It will depend upon its use.
- If a sewing machine is purchased by a tailor, then it is a fixed asset of the tailor and considered to be a capital good. But the same machine purchased by a consumer household is considered to be a durable use consumer goods.
- If a car purchased by a taxi driver as a taxi or if purchased by a firm for use in its business is a capital good. But the same car purchased by a consumer household is a durable use consumer goods.
Note: So, finally, the end user of a good determine, whether it is capital good or durable use consumer goods. If an end user of a durable goods is a producer, it is a capital good. If an end user of a durable goods is a consumer household, it is a durable use consumer goods. So, capital goods are only those durable goods which are used as producer goods, not as consumer goods.
VII. VALUE BASED QUESTION
1. Compensation to flood victims is a good social security measure by the government. But why is it not included in the estimation of national income?
Ans: Because this is a transfer payment. Value: Implement of Knowledge
VIII. APPLICATION BASED QUESTIONS
1. The concept of domestic territory helps to estimate ‘Domestic Product’. Defend or refute.
Ans: The concept of domestic territory helps to estimate ‘Domestic Product’. As we know Domestic Product includes goods and services produced by production units located in the domestic territory (irrespective of fact whether carried out by residents or non-residents). The money value of domestic product is termed as Domestic Income.
2. The concept of Normal Resident helps to estimate ‘National Product’. Defend or refute.
Ans: The concept of Normal Resident helps to estimate “National Product’. National Product includes production activities of normal residents irrespective of fact whether performed within the economic territoiy or outside it. The money value of national product is termed as National Income.
Question 5. In which form of the market structure is the degree of control over the price of its product by a firm very large?
(a) Monopoly
(b) Imperfect Competition
(c) Oligopoly
(d) Perfect competition
Answer: (a)
Question 6. Under which one of the following forms of market structure does a firm have no control over the price of its product?
(a) Monopoly
(b) Monopolistic competition
(c) Oligopoly
(d) Perfect competition
Answer: (d)
Question 7. Price discrimination will be profitable only if the elasticity of demand in different sub markets is:
(a) Uniform (b) Different
(c) Less (d) Zero
Answer: (b)
Question 8. Suppose that the demand curve for the XYZ Co. slopes downward and to the right. We can conclude that
(a) The firm operates in a perfectly competitive market.
(b) The firm can sell all that it wants to at the established market price.
(c) The XYZ Co. is not a price taker in the market because it must lower the price to sell additional units of output.
(d) The XYZ Co. will not be able to maximise profits because price and revenue are subject to change.
Answer: (c)
Question 9. One characteristic not typical of Oligopolistic industry is its:
(a) Horizontal demand curve.
(b) Too much importance to non-price competition.
(c) Price leadership.
(d) A small number of firms in the industry.
Answer: (a)
Question 10. A Monopolist is a price:
(a) Maker (b) Taker
(c) Adjuster (d) None of these.
Answer: (a)
Question 11. Price discrimination is one of the features of
(a) monopolistic competition
(b) monopoly
(c) perfect competition
(d) oligopoly
Answer: (b)
Question 12. Pure oligopoly is based on the————– products.
(a) differentiated (b) homogeneous
(c) unrelated (d) None of these
Answer: (b)
Question 13. The firm and the industry are one and the same in————-.
(a) perfect competition
(b) monopolistic competition
(c) duopoly (d) monopoly
Answer: (d)
Question 14. The demand curve of a monopoly firm will be———————–.
(a) upward sloping
(b) downward sloping
(c) horizontal (d) vertical
Answer: (b)
III. Short Answer Type Questions (3-4 Marks)
Question 1. A monopolist can sell any quantity he likes at a price. Give reasons with true or false. [CBSE 2013]
Answer: False: A monopolist cannot sell any quantity he likes at a price.
- A monopolist faces a downward sloping demand curve because of price discrimination which means that a monopolist can sell more quantity only by lowering the price.
- A monopolist controls only the supply of the product and not the demand of the product.
Question 2. Why AR curve (demand curve) under monopolistic competition is more elastic than AR curve under monopoly? [AI 2013]
Answer:
- AR curve under both the markets slope downwards.
- However, AR curve under monopolistic competition is more elastic as compared to AR curve under monopoly because of presence of close substitutes.
- AR curve is less elastic in monopoly because of no close substitutes.
Question 3. Explain the feature of few firms in an oligopoly market. [AI 2012]
Answer:
- The number of sellers in an oligopoly market is small—when there are two or more than two, but not many sellers.
- What matters is that these few sellers account for most of the industry’s sales.
- These “few” sellers consciously dominate the industry and indulge in intense competition. Each firm is aware of that it possesses a large degree of monopoly power.
- For example, the market for mobile service provider in India is an oligopolist structure as there are only few producers of mobile service provider. There exists severe competition among different firms and each firm tries to manipulate both prices and volume of production to outsmart each other.
Question 4. Explain the main features of barriers to the entry of firms. [AI 2013]
Answer:
- The main reason why the number of firms is small is that there are barriers which prevent entry of firms into industiy.
- Patents, large capital, control over the crucial raw material etc, prevent new firms from entering into industry.
- Only those who are able to cross these barriers are able to enter.
Question 5. Give reasons for the following statements:
- Demand curve facing a perfectly competitive firm is a horizontal straight line.
- Demand curve facing a monopolistic competitive firm is a downward sloping curve.
- Demand curve facing a monopoly firm is less elastic than that curve facing a monopolistic competitive firm.
Answer:
- Under perfect competition, every firm is a price-taker firm. The price is set by industry demand and supply. Therefore, every firm faces a horizontal straight line demand curve indicating that it can sell any quantity at the given price.
- A monopolistic competitive firm has to design its own pricing strategy. It can expect to sell larger quantity at a lower price, and vice-versa. Hence, its demand curve slopes downwards.
- A monopolist is the only producer of a good which has no close substitutes. A monopolistic competitive firm, on the other hand, produces a good that has several close substitutes. Hence, the demand curve facing a monopolistic competitive firm is more elastic than that faced by a monopoly firm.
Question 6. Draw a demand curve in different market situation and also compare its elasticity of demand.
Answer: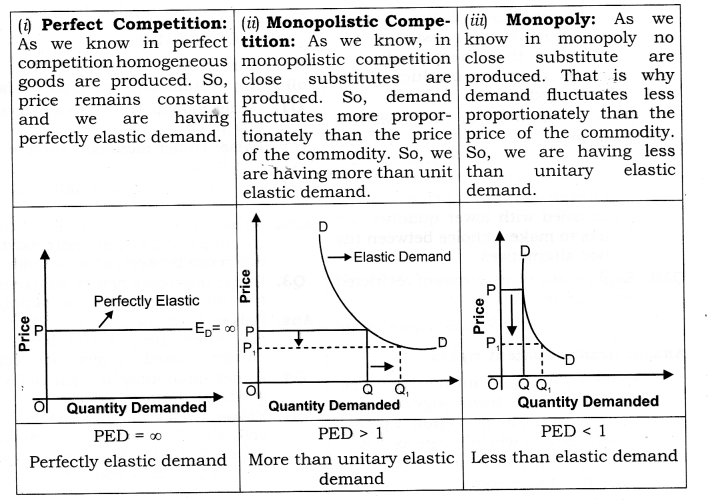
Question 7. Give reasons for the following statements:
- A perfectly competitive firm is a price-taker.
- Product differentiation is a characteristic feature of a monopolistic competitive market,
- A monopolist cannot fix both the quantity that he likes to produce and the price at which he would like to sell.
Answer:
- In a perfectly competitive market there are a large number of producers of a product. All of them produce a homogeneous product. Therefore, all the firms have to sell at the same price. This price is determined by industry demand and supply.
- In a monopolistic competitive market there is a large number of producers. But each of these producers produces a product which is somewhat different from what others do. At least, the producers make all the attempts to influence the consumer with the idea that their product is better than the product of the rival producers.
- A monopolist is faced with a downward sloping curve. He can sell a larger quantity at a lower price; or alternatively, he may charge a higher price and be satisfied with lower quantity. He has to make a choice between the two alternatives.
Question 8. Explain any two sources of restricted entry under monopoly.
[CBSE Sample Paper 2016]
Answer:
- Grant of patent rights
(i) When a company introduces a new product or new technology it applies to the government to grant it patent certificate by which it gets exclusive rights to produce new product or use new technology.
(ii) Patent rights prevent others to produce the same product or use the same technology without obtaining license from the concerned company. Patent rights are granted by the government for a certain number of years. - Licensing by Government : A monopoly market emerges when government gives a firm license, i.e. exclusive legal rights to produce a given product or service in a particular area or region.
Question 9. What is meant by price rigidity, under oligopoly.[CBSE Sample Paper 2016]
Answer:
- Price rigidity refers to a situation in which whether there is change in demand and supply the price tends to stay fixed.
- If a firm tries to reduce the price the rivals will also react by reducing their prices. Likewise, if it tries to raise the price, other firms will not do so. It will lead to loss of customers for the firm which intended to raise the price.
IV. TRUE OR FALSE
Giving reasons, state whether the following statements are true or false.
Question 1. Under monopoly all firms can sell at any price.
Answer: False: Under monopoly there is only one firm.
Question 2. In monopoly, firm is different from industry.
Answer: False: There is only one firm in monopoly market, so there exists no difference between firm and industry.
Question 3. Under monopoly new firms can enter the industry to raise the supply.
Answer: False: In monopoly, no other firm can enter into industry because of barrier created by monopoly firm.
Question 4. Under monopoly a firm sells the goods at a single price.
Answer: False: Under monopoly a firm can sell all of its output at different prices due to it’s complete control over supply and market.
Question 5. Under monopolistic competition there is only one seller of the product.
Answer: False: Under monopolistic competition, there are large number of buyers and also large number of sellers.
Question 6. Under monopolistic competition price discrimination can be made easily.
Answer: False: There is no possibility of price discrimination in the sales of goods in this market because of product differentiation.
Question 7. Under monopolistic competition, all the customers have perfect knowledge of the market conditions.
Answer: False: under monopolistic competition there is a large variety of a single
product, so they do not get perfect knowledge of the market conditions.
Question 8. Under oligopoly, there are large number of buyers and sellers.
Answer: False: In oligopoly there are a few sellers and a large number of buyers
Question 9. Under monopolistic competition, a firm faces a perfectly elastic demand curve. [CBSE, 2012]
Answer: False: Monopolistic competitive firm faces downward sloping demand curve as it can sell more only by lowering the price.
Note: As per CBSE guidelines, no marks will be given if reason to the answer is not explained.
V. Long Answer Type Questions (6 Marks)
Question 1. Compare between perfect competition and monopoly.
Answer: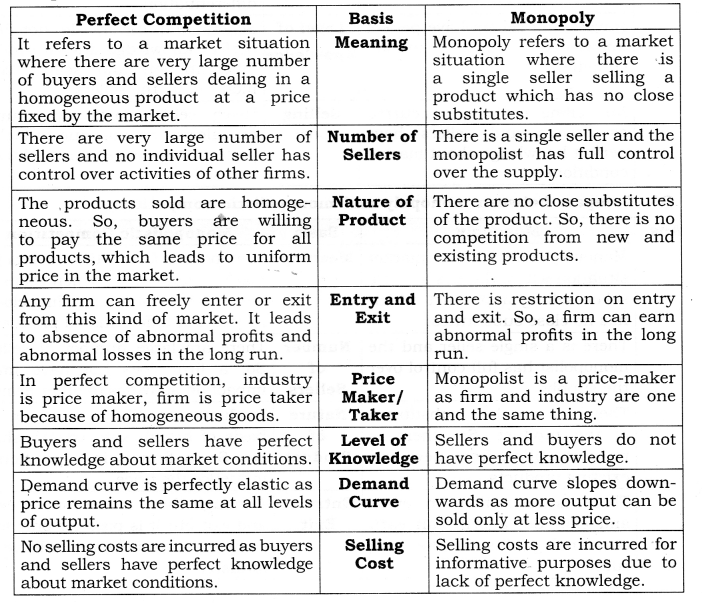
Question 2. Compare between perfect competition and monopolistic competition.
Answer: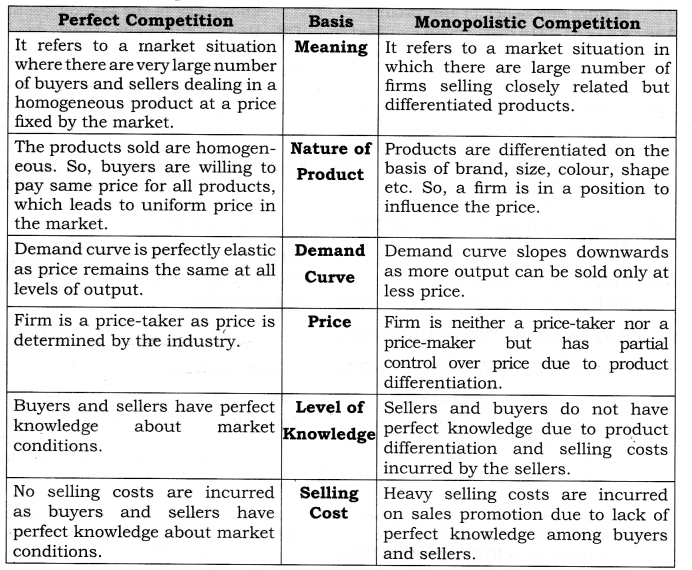
Question 3. Compare between monopoly and monopolistic competition.
Answer: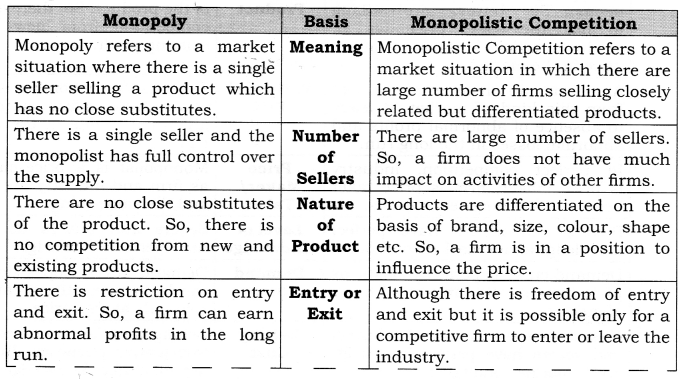

VI. Higher Order Thinking Skills
Question 1. Demand curve facing a monopoly firm is a constraint for the monopolist.” Comment. [3-4 Marks]
Answer:
- A monopoly firm has market power and is itself a price-maker. It can choose any price, it likes.
- Unlike perfect competition where as output increases, price remains unchanged.
- In monopoly as output increases or decreases, price changes according to what consumers are willing to pay along the demand curve. It produces and supplies a product to satisfy the entire market.
- It is because a monopoly firm faces the entire demand of the market, that market demand curve is said to be a constraint facing a monopoly firm.
Question 2. Explain the implication of the following: The feature of ‘no close substitutes’ under monopoly. [3 Marks]
Answer: No close substitute:
- A monopolist produces all the output in a particular market. So, there is no close substitute in monopoly.
- The monopolist is a ‘price-maker’. It does not mean that monopolist can fix both price and the quantity demanded. If he fixes a high price, less commodity will be demanded.
- Implication: The result is an inelastic demand curve as shown in Figure. The demand curve is a constraint facing a monopoly firm. Demand curve is also the price line and the AR curve. Since AR is downward sloping, MR lies below AR curve and is twice as steep as the AR curve.
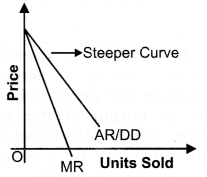
Question 3. Distinguish between cooperative and non-cooperative oligopoly. [AT 2015]
Or
Differentiate between collusive and non-collusive oligopoly. [3-4 Marks]
Answer: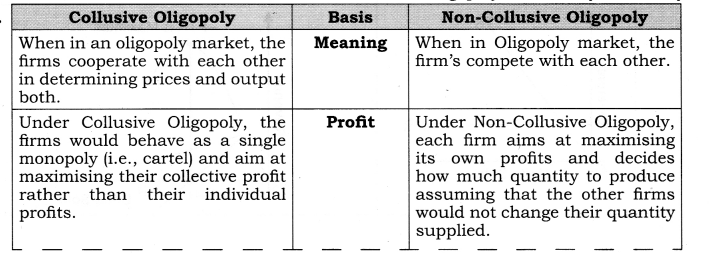

Question 4. What do you mean by duopoly? [1 Mark]
Answer: When there are only two firms producing a product, it is called duopoly. Under duopoly it is assumed that the product sold by the two firms is homogeneous and there is no substitute for it. It is a special case of oligopoly.
Question 5. Which features of monopolistic competition are monopolistic in nature? [1 Mark]
Answer: The features of monopolistic competition are:
- Product differentiation
- Downward sloping AR and MR curves.
Question 6. Which features of monopolistic competition are competitive in nature? [ 1 Mark]
Answer: The features of monopolistic competition, which are competitive in nature are:
- Large number of sellers; and
- Freedom of entry and exit.
Question 7. What is the importance of monopoly? [1 Mark]
Answer:
- Patent rights encourage discovery and invention of new product and technique.
- Public monopolies (like railways, etc) protect the rights and interest of the public and saves them from exploitation.
Question 8. Discuss the relationship between total revenue, average revenue and marginal revenue under perfect competition and monopolistic competition. Use diagrams. [3-4 Marks]
Answer: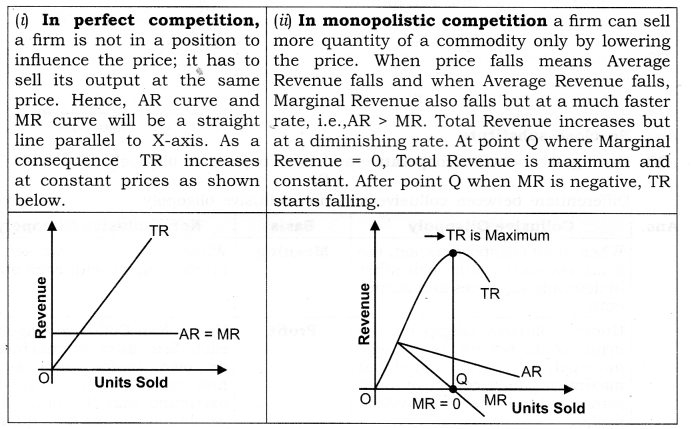
VII. Value Based Questions
Question 1. In spite of having monopoly why the Indian Railways has not increased the fare for many years? [1 Mark]
Answer: Indian Railway is a major public sector undertaking and its main motive is social welfare not the profit. Value: Social welfare
Question 2. How to reduce the incidence of selling cost under monopolistic competition because of which price tends to be higher than what it would have been if production cost would have been the sole basis? [1 Mark]
Answer: The cost incurred on advertisement and salesmanship constitutes selling cost which affects the minds of buyers in favour of certain commodities. In this situation buyers should care for intrinsic value and utility. This way the role of selling cost will be reduced.
Value: Analytic
Question 3. Under oligopoly though firms are free to take decisions about price and quantity to be sold but they do not change the price and hence buyers are deprived of the benefit of fall in price. Comment. [I Mark]
Answer: Oligopoly firms are mutually dependent and therefore while fixing the price and the output they are guided by the reactions of other firms. As such price tends to be rigid and the consumers suffer.
Value: Critical thinking
Question 4. Although there are few (more than one) firms in oligopoly. Even these firms can enjoy monopoly power. How? [ 1 Mark]
Answer: Firms in oligopoly form cartel and in this way these firms can control over prices.
Value: Critical thinking
VIII. Application Based Questions
Question 1. How the efficiency may increase if two firms merge? [3-4 Marks]
Answer:
- Suppose that initially there are two firms in an industry and both are same but inefficient.
- Their MC curves are at a high level and consequently they charge a higher price and produce less.
- They realize, however, that if they merge with each other – and thereby become a monopoly—they can reduce their cost.
- For instance, one firm may have excellent technical manpower but may not have good marketing skills, whereas the other may not have good technical manpower but possesses superior marketing knowledge by merging the resulting monopoly firms MC curve will be at a lower level and thus it will be more efficient firm.
- This, by itself will induce the monopoly to charge a price which is less and produce a quantity which is greater than when both firms were competing with each other.
Question 2. Selling cost is a nail in the coffin of consumer’s sovereignty. How? [3 Marks]
Answer:
- Selling cost is the expenses which are incurred for promoting sales or inducing customers to buy a good of a particular brand.
- Theoretically, a consumer is the king because whatever he desires/ demands is produced/supplied,
- But in reality this is not so. Advertisement and salesmanship bias his mind in favour of certain commodities which otherwise may not be good.
Question 3. “A day without selling costs is nearly impossible”. Comment. [3 Marks]
Answer:
- The given statement is correct. It is the expenses which are incurred for promoting sales or inducing customers to buy a good of a particular brand.
- This includes, the cost of advertisement through newspaper, television and radio and cost on each other sales promotional activities.
- As selling costs by the firms in the form of various promotional tools have become a routine activity and the firm generally persuades or lures the customer to avail from one brand to another.
Question 4. Average revenue will always be equal to marginal revenue in all market conditions. Defend or refute. [1 Mark]
Answer: Refute: MR and AR will be equal only for a perfectly competitive firm, because it is faced with a horizontal straight line demand curve. Under all other market conditions MR will always be less than AR.
Question 5. Price discrimination should be socially desirable. How? [1 Mark]
Answer: There should be an approach on the part of the Monopoly Firm to fix lower prices for poor people and backward areas for its product.
Question 6. If the firm in the toothpaste industry have the following market shares, which market structure would best describe the industiy? [1 Mark]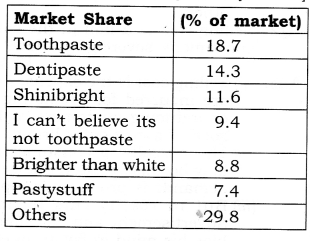
Answer: Oligopoly market best describes the market structure of toothpaste industry.
Question 7. Suppose that the demand curve for the XYZ company slopes downward and to the right. Would you conclude that the firm is a price taker or a price maker? Give reasons. [3 Marks]
Answer:
- Since the demand curve of XYZ Co. is downward sloping, it has to lower its price to sell additional units of output.
- But in perfect competition the demand curve is parallel to x-axis as the firm can sell any amount of the output at the same price.
- Hence, XYZ Co. is not a price- taker but a price maker.
Question 8. Because of product differentiation under monopolistic competition, price tends to be higher than what it ought to have been in real terms and hence consumers suffer. How? [3 Marks]
Answer:
- Product differentiation is created by artificial differences such as change in colour, fragrance, certain features etc.
- But as such all the products are close substitutes to each other,
- This feature of product differentiation results in the downward sloping demand curve because of which prices tend to be more and hence the consumers suffer.
Class 12 Micro Economics Market Equilibrium with Simple Applications
Very Short Answer Type Questions (1 Mark)
Question 1. Define market equilibrium. [CBSE Foreign 2011]
Answer: Market equilibrium refers to the situation when market demand is equal to the market supply.
Question 2. Give the meaning of equilibrium price. [CBSE, Sample Paper 2010]
Answer: The price at which equilibrium is reached is called equilibrium price.
Question 3. Give the meaning of equilibrium quantity.
Answer: The quantity bought and sold at the equilibrium price is called equilibrium quantity.
Question 4. What is equilibrium point?
Answer: Equilibrium point is the point of intersection of the demand curve and supply of commodity.
Question 5. When do you say there is excess demand for a commodity in the market?
Answer: When Market price is below the equilibrium price, then at that given price, demand is greater than supply that leads to excess demand.
Question 6. When do you say there is excess supply for a commodity in the market?
Answer: When market price is above the equilibrium price, then at that given price, demand is lesser than supply, that leads to excess supply.
Question 7. For a non-viable industry where does the supply curve lie relative to demand curve?
Answer: Supply curve lies above the demand curve.
Question 8. A severe drought results in a drastic fall in the output of wheat. Analyse how will it affect the market price of wheat?
Answer: Market price of wheat will increase (due to decrease in supply).
Question 9. What happens to equilibrium price of a commodity if there is ‘decrease’ in its demand and ‘increase’ in its supply? [CBSE Sample Paper 2008]
Answer: Equilibrium price will fall.
Question 10. What happens to equilibrium price of a commodity if there is an ‘increase’ in its demand and ‘decrease’ in its supply? [CBSE Sample Paper 2010]
Answer: Equilibrium price will increase.
II. Multiple Choice Questions (1 Mark)
Question 1. If price is above then equilibrium Price, there is:
(a) excess demand
(b) excess supply
(c) price ceiling
(d) price flooring
Answer: (b)
Question 2. With a given supply curve a decrease in demand causes—————-.
(a) an overall decrease in price but an increase in equilibrium quantity.
(b) an overall increase in price but a decrease in equilibrium quantity.
(c) an overall decrease in price and a decrease in equilibrium quantity.
(d) no change in overall price but a reduction in equilibrium quantity.
Answer: (c)
Question 3. Assume that consumers’ incomes and the number of sellers in the market for goods A both decrease. Based upon this information, we can conclude, with certainty, that the equilibrium
(a) price will increase.
(b) price will decrease.
(c) quantity will increase.
(d) quantity will decrease.
Answer: (d)
Question 4. Suppose that the supply of cameras increases due to an increase in imports. Which of the following statements will most likely occur?
(a) The equilibrium price of cameras will increase.
(b) The equilibrium quantity of cameras exchanged will decrease.
(c) The equilibrium price of camera film will decrease.
(d) The equilibrium quantity of camera film exchanged will increase.
Answer: (d)
Question 5. Assume that in the market for a good Z there is a simultaneous increase in demand and the quantity supplied. The result will be:
(a) An increase in equilibrium price and quantity.
(b) A decrease in equilibrium price and quantity.
(c) An increase in equilibrium quantity and uncertain effect on equilibrium price.
(d) A decrease in equilibrium price and increase in equilibrium quantity.
Answer: (c)
Question 6. Suppose the technology for producing personal computers improves and, at the same time, individuals discover new uses for personal computers so that there is greater utilization of personal computers. Which of the following statements/factors will happen to equilibrium price and equilibrium quantity?
(a) Price will increase; quantity cannot be determined.
(b) Price will decrease; quantity cannot be determined.
(c) Quantity will increase; price cannot be determined.
(d) Quantity will decrease; price cannot be determined.
Answer: (c)
Question 7. When there is increase in demand and decrease in supply, equilibrium price:
(a) Falls (b) Rises
(c) Constant (d) None of these
Answer: (b)
III. Short Answer Type Questions (3-4 Marks)
Question 1. Under what condition increase in demand would not make any effect on equilibrium price?
Answer: Case I: When supply also increase at the same rate as the demand increases
In the given diagram price is measured on vertical axis and quantity demanded and supplied is measured on horizontal axis. Initially, the equilibrium price is OP and equilibrium quantity is OQ. But when “demand and supply both increase at the same rate” then,
- Equilibrium price remains – constant at OP; and
- Equilibrium quantity rises from OQ to OQ1
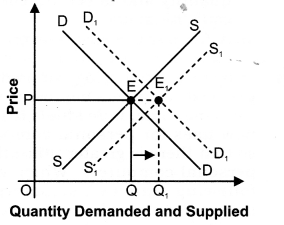
Case II: When supply becomes perfectly elastic – In the given diagram price is measured on vertical axis and quantity demanded and supplied is measured on horizontal axis. Initially, the equilibrium price is OP and equilibrium quantity is OQ. But when “supply becomes perfectly elastic and demand increases then,
- Equilibrium price remains constant at OP; and
- Equilibrium quantity rises from OQ to OQ1
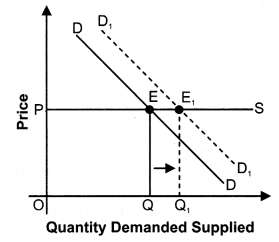
Question 2. Under what condition increase in demand would not make any effect on equilibrium quantity?
Answer: Case I: When supply decreases at the same rate as the demand increase
In the given diagram price is measured on vertical axis and quantity demanded and supplied is measured on horizontal axis. Initially, the equilibrium price is OP and equilibrium quantity is OQ.
But when, “demand increases and supply decreases but at the same rate”, then,
- Equilibrium price rises from OP to OP1 and
- Equilibrium quantity remains constant at OQ.
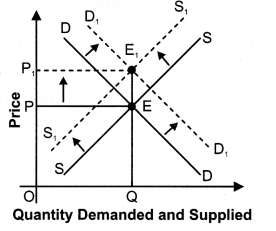
Case II: When supply becomes perfectly inelastic
In the given diagram price is measured on vertical axis and quantity demanded and supplied is measured on horizontal axis. Initially, the equilibrium price is OP and equilibrium quantity is OQ.
But when “supply becomes perfectly inelastic and demand increase” then,
- Equilibrium price rises from OP to OP1 and
- Equilibrium quantity remains constant at OQ.
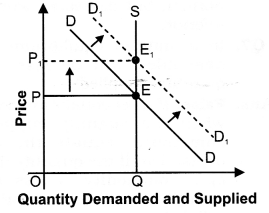
Question 3. Give reasons for the following statements:
- A decrease in supply will not result in a change in equilibrium quantity if the demand for a commodity is perfectly inelastic.
- An decrease in supply will not result in a change in equilibrium price if the demand for a commodity is perfectly elastic.
Answer:
- If the demand for a commodity is perfectly inelastic, i.e., if the demand curve is a vertical straight line, a decrease in supply curve will result only in a change in the equilibrium price, but no change in the equilibrium quantity.
- If the demand for a commodity is perfectly elastic, i.e., if the demand curve is a horizontal straight line, a decrease in supply curve will result only in change equilibrium quantity, but no change in equilibrium price.
Question 4. Explain the effects of a ‘price ceiling’. [CBSE Sample Paper 2014] Or
Explain the effects of ‘maximum price ceiling’ on the market of a good. Use diagram. [CBSE 2015]
Answer:
- When the government imposed upper limit on the price (maximum price) of a good or service which is lower than equilibrium price is called price ceiling.
- Price ceiling is generally imposed on necessary items like wheat, rice, kerosene etc.
- It can be explained with the help of diagram below:
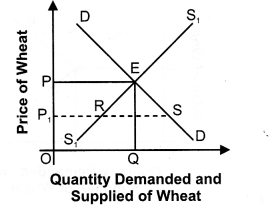
(a) In the given diagram, DD is the market demand curve and SS is the market supply curve of Wheat. Suppose, equilibrium price OP is very high for many individuals and they are unable to afford at this price.
(b) As wheat is necessary product, government has to intervene and impose price ceiling of Pi; which is below the equilibrium level.
(c) Since this price is below equilibrium price, there is excess demand in the market. With shortages, sellers tend to hoard the product. It could also lead to black marketing.
Question 5. Explain the effects of a ‘price floor’. [CBSE Sample Paper 2014] Or
What are the effects of ‘price – floor’ (minimum price ceiling) on the market of a good? Use diagram.
Answer:
- When the government imposed lower limit on the price (minimum price) that may be charged for a good or service which is higher than equilibrium price is called price floor.
- Price Floor is generally imposed on agricultural price support programmes and the minimum wage legislation.
- Since this price is above equilibrium price, there is excess supply in the market. Since there is surplus, sellers can attempt to sell their product at a price below the floor price.
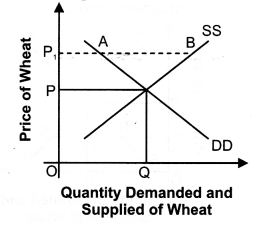
IV. True Or False
Giving reasons, state whether the following statements are true or false:
Question 1. Equilibrium between demand and supply helps in determining prevailing price of the product.
Answer: False: An equilibrium between demand and supply determines only equilibrium price.
Question 2. In case of excess demand, equilibrium price is less than prevailing price.
Answer: False: When there is excess demand, equilibrium price is greater than prevailing price.
Application Based Questions
Question 1. Mrs Ramgopal says that economists say inconsistent things: as price falls, demand rises but as demand rises, prices rises. Defend or refute. [3-4 Marks]
Answer: We defend the statement of Mrs Ramgopal. As price falls, demand rises. According to Law of Demand, there is inverse relationship between demand and price. Leaser price leads to higher demand.
Demand = f (price)
When demand rises, prices also rises. Price is function of twin forces of demand and supply.
Price = f (demand, supply)
In the given figure, price is measured on vertical axis and quantity demanded and supplied is measured on horizontal axis. Initially, the equilibrium price is OP and equilibrium quantity is OQ. But due increase in demand, the demand curve shifts rightward from DD to D1D1.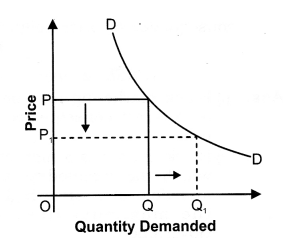
With new demand curve D1D1, there is excess demand at initial price OP because at price OP, demand is PB and supply is PA, so there is excess demand of AB at price OP.
Due to this excess demand, competition among the consumer will raise the price. With the rise in price, there is upward movement along the demand curve (contraction in demand) from B to C and similarly, there is upward movement along the supply curve (expansion in supply) from A to C . So, finally equilibrium price rises from OP to OP1 So, demand rises, price rises.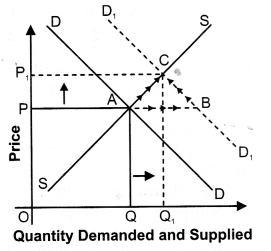
Question 2. “An increase in the demand for notebooks raises the quantity of notebooks demanded, but not the quantity supplied.” Is this statement true or false? Explain. [3-4 Marks]
Answer: The statement that “an increase in the demand for notebooks raises the quantity of notebooks demanded, but not the quantity supplied,” in general, is false. As given figure shows, the increase in demand for notebooks results in an increased quantity supplied.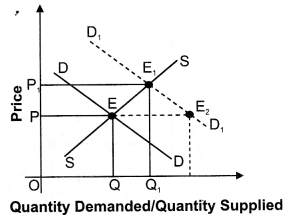
Question 3. China is a big manufacturer of telephone instruments. It has recently become a member of WTO, which means that it can sell its product in other member countries like India. Suppose that it does export a large number of telephone instruments to India. [ 6 Marks]
- How will it affect the price and quantity sold of telephone instruments in India?
- Suppose that the demand for telephone instruments is relatively elastic. How will it affect India’s total expenditure on telephone instruments?
Answer:
- The supply of telephone instruments in India will increase. An increase in supply of telephone instruments will result in a . rightward shift of the supply curve from SS to S1S1 as shown below: The supply curve shifts rightward from SS to S1S1. With new supply curve S1S1 there is excess supply at initial price OP because at price OP supply is PB and demand is PA; so there is excess supply of AB at price OP.
- Due to this excess supply, competition among the producer will fall the price. Due to this fall in price there is downward movement along the supply curve (Contraction in supply) from B to C and similarly there is downward movement along the demand curve (Expansion in demand) from A to C. So, finally, equilibrium price falls from OP to OP1, and equilibrium quantity rises from OQ to OQ1
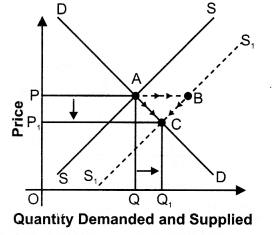
Conclusion
Due to increase in number of firms,
(a) Equilibrium price of telephones falls from OP to OP1
(b) Equilibrium quantity of telephones rises from OQ to OQ1.
For a product with relatively elastic demand a fall in the price of a commodity results in a relatively larger expenditure by the consumers. Thus, the total expenditure on telephones will increase.
Question 4. Given below are four statements.Indicate for each whether it reflects an increase or decrease in demand;quantity demanded; supply; quantity supplied. [3-4 Marks]
- Air Deccan reduces its average plane fare by 30% in order to attract more passengers.
- The government grants export subsidy to producers of oranges in Nagpur to increase the sale of oranges abroad.
- Wheat farmers decide to withhold wheat as the market price is low.
- OPEC decides to increase the international oil price.
Answer:
- Increase in quantity demanded
- Increase in supply.
- Decrease in supply.
- Decrease in quantity demanded.
Question 5. Explain “black marketing’ as a direct [3-4 Marks] [CBSE Sample Paper 2016]
Answer:
- Black marketing may be termed as a direct consequence of price ceiling.
- Black market is a market under which the commodity is bought and Sold at a price higher than the maximum fixed by the Government.
- It arises due to presence of consumers who may be willing to pay higher price for the commodity than to go without it.
Question 6. Explain the concept of “buffer stock’ as a tool of price floor. [3-4 Marks]
[CBSE Sample Paper 2016]
Answer:
- Government ensures price Floor/ minimum Support price with the tool called buffer stock.
- If government feels market price is lower than what it ought to be, it would purchase the commodity at higher price from the farmers, producers so as to maintain stock.
Class 12 Macro Economics Chapter-1 Introduction to Macroeconomics and its Concepts
1. Describe the five major sectors in an economy according to the macroeconomic point of view.[3-4 Marks]
Ans: An economy may be’ divided into different sectors depending on the nature of study.
- Producer sector engaged in the production of goods and services.
- Household sector engaged in the consumption of goods and services.
Note: Households are taken as the owners of factors of production. - The government sector engaged in activities like taxation and subsidies.
- Rest of the world sector engaged in exports and imports.
- Financial sector (or financial system) engaged in the activity of borrowing and lending.
2. What are the four factors of production and remunerations to each of these called? [ 1 Mark]
Ans: 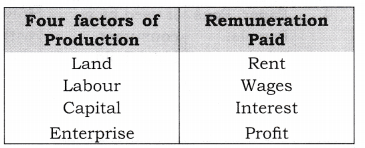
3. What are the important features of a capitalist economy? [3-4 Marks]
Ans: Features of capitalist economy are:
- Private ownership of land and capital.
- Profit is the only motive.
- Free play of the market forces of demand and supply.
- Government looks after growth, stability and social justice in the economy.
4. Describe the Great Depression of 1929. [3-4 Marks]
Ans: The Great Depression took place in 1929 which adversely affected the developed economies of Europe and North America. It continued for 10 years. There was extreme fall in aggregate demand due to fall in income, which led to a vicious circle of poverty.
5. Distinguish between stock and flow. Between net investment and capital which is a stock and which is a flow? Compare net investment and capital with flow of water into a tank. [3-4 Marks]
Ans: 
Net investment is a flow whereas capital is a stock. Amount of water in a tank at a particular point of time is a stock concept, whereas amount of water flowing into it is a flow concept.
MORE QUESTIONS SOLVED
I. VERY SHORT ANSWER TYPE QUESTIONS (1 Mark)
1. What is meant by circular flow of income?
Ans: It refers to flow of money income or the flow of goods and services across different sectors of the economy in a circular form.
2. What are the three phases of circular flow of income?
Ans: Production Phase, Distribution Phase and Disposition Phase.
Question 3. Give the meaning of factor income.
Ans: Income earned by factor of production by rendering their productive services in the production process is known as Factor Income.
4. What is meant by transfer income?
Ans: Income received without rendering any productive services is known as Transfer Income.
5. Out of factor income and transfer income which one is a unilateral concept?
Ans: Transfer income.
6. Define current transfers.[CBSE 2003]
Ans: Transfers made from the current income of the payer and added to the current income of the recipient (who receive) for consumption expenditure are called current transfers.
7. Define capital transfers.
Ans: Capital transfers are defined as transfers in cash and in kind for the purpose of investment to recipient made out of the wealth or saving of a donor.
8. What is the meaning of final goods?
Ans: These are those which are used for:
- Personal consumption (like bread purchased by consumer household), or
- Investment or capital formation (like building, machinery purchased by a firm)
9. What is meant by intermediate goods?
Ans: These are those, which are used for:
- Further processing (like sugar used for making sweets), or
- Resale in the same year (If car purchased by a car dealer for resale).
10. What is meant by consumption goods?
Ans: Consumption goods are those goods which satisfy the wants of consumers directly.
11. Define capital goods.
Ans: Capital goods are defined as all goods produced for use in future productive processes.
Class 12 Macro Economics Chapter-2 National Income and Related Aggregates
1. Why should the aggregate final expenditure of an economy be equal to the aggregate factor payments? Explain. [3 Marks]
Ans: The sum of final expenditures in an economy must be equal to the income received by all the factors of production taken together (final spending on final goods, it does not include spending on intermediate goods). This follows from the simple idea that the revenues earned by all the firms put together must be distributed among the factors of production as salaries, wages, profits, interests earning and rents.
2. What is the difference between planned and unplanned inventory accumulation? Write down the relation between change in inventories and value added of a firm. [3 Marks]
Ans: Planned Inventory. It refers to changes in the stock inventories that have occurred in a planned way. In a situation of planned inventory accumulation, firm will plan to raise its inventories. Unplanned Inventory. It refers to changes in the stock of inventories that have occurred in an unexpected way. In a situation of unplanned inventory accumulation, due to unexpected fall in sales, the firm will have unsold stock of goods.
Value added of a firm (GVA) = Gross value of output produced by the firm – Value of intermediate goods used by the firm.
OR
GVA = Value of sales by the firm + Value of change in inventories – Value of intermediate goods used by the firm
3. Write down the three identities of calculating the GDP of a country by the three methods. Also, briefly explain why each of these should give us the same value of GDP. [3 Marks]
Ans: National Income = National Product = National Expenditure. Each one will give the same result. The only difference is that with product methods, NI is calculated at production or creation level with income Method NI is measured at distribution level, and with expenditure method NI is measured at disposal level.
4. Define budget deficit and trade deficit. The excess of private investment over saving of a country in a particular year was Rs 2,000 crores. The amount of budget deficit was (-) Rs 1,500 crores. What was the volume of trade deficit of that country? [3-4 Marks]
Ans: Budget deficit. It measures the amount by which the government expenditure exceeds the tax revenue earned by it. Budget Deficit = G – T.
Trade deficit: It measures the amount of excess expenditure over the export revenue earned by the country.
Trade Deficit = M – X
Given G – T = (-) Rs 1500 crore
Investment – Saving = Rs 2000 crore Trade deficit = [I – S] + [G – T]
= [2000]+ [-1500] = Rs 500 crore.
6. Net National Product at Factor Cost of a particular country in a year is Rs 1,900 crores. There are no interest payments made by the households to the firms / government, or by the firms / government to the households. The Personal Disposable Income of the households is Rs 1,200 crores. The personal income taxes paid by them is Rs 600 crores and the value of retained earnings of the firms and government is valued at Rs 200 crores. What is the value of transfer payments made by the government and firms to the households? [3-4 Marks]
Ans: Personal disposable income = Personal income – Personal tax – miscellaneous receipts of government 1200 = Personal Income – 600 – 0 Personal Income = 1800 Crore Private Income = Personal income + retained earnings + corporate tax = 1800 + 200 + 0 = 2000 Crore Private income = NNPFC (National income) – NDPFC of government sector + Value of transfer payment 2000 = 1900 – 0 + Value of transfer payment
Value of transfer payment =100 Crore
7. From the following data, calculate Personal Income and Personal Disposable Income. [6 Marks]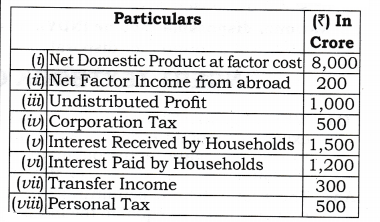
Ans: Private Income = NDPFC – NDPFC of government sector + NFIA + Transfer Income + net interest receive from household (Interest Received by Households – Interest Paid by Households) = (i) – 0 + (ii) + (vii) + [(v) – (vi)]
= 8000 + 200 + 300 + (1500 – 1200)
= 8800 Crore
Personal Income = Private income – Undistributed profit – Corporation tax = 8800 – (iii) – (ii)
= 8800 – 1000 – 500 = 7300 Crore
Personal Disposable Income =
Personal income – Personal tax = 7300 – (viii)
= 7300 – 500 = 6800 Crore
VERY SHORT ANSWER TYPE QUESTIONS (1 Mark)
1. Define ‘depreciation’. [CBSE (Al) 2011]
Ans: Depreciation is an expected decrease in the value of fixed capital assets due to its general use.
2. When is the net domestic product at market price less than the net domestic product at factor cost?
Ans: When net indirect taxes are negative i.e., subsidies are more than indirect taxes.
3. Why does gross domestic product at factor cost more than the net domestic product at factor cost?
Ans: Gross domestic product at factor cost includes depreciation while net domestic product at factor cost does not include depreciation.
4. When will GDP of an economy be equal to GNP?
Ans: GDP and GNP will be equal when the ‘net factor income from abroad’ is zero.
5. When will the domestic income exceed the national income?
Ans: When the net factor income from abroad is negative.
6. If NDPFC is Rs 1,0000 crores and NFIA is (-) Rs 500 crores, how much will be the national income?
Ans: National Income = 10000 + (-500)
= Rs 9500 Crore
7. If the domestic factor income is Rs 50,000 crores and the national income is Rs 45,000 crores, how much will be the net factor income from abroad?
Ans: Net factor income from abroad = 45,000 – 50,000 = (-) Rs 5000 Crore
8. Mention the three methods of measuring national income.
Ans:
- Value added method
- Income method
- Expenditure method.
9. Calculate the disposable income, if personal income is Rs 30,000 and the rate of income tax is 10%.
Ans: Disposable Income = 30,000 – (10% of 30,000) = ?27,000
10. In which type of economy, domestic income will be equal to national income?
Ans: Closed economy
11. What is the value added method of measuring national income?
Ans: Value added method is the method that measures the national income by estimating the value added by each producing enterprises within the domestic territory of the country in an accounting year.
12. When is value of output equal to value added?
Ans: Value of output is equal to value added if there are no intermediate costs.
13. What aggregate do we get when we add up the gross value added of all the producing sectors of an economy?
Ans: Gross domestic product at market price.
14. What is the rationale for not taking into account the value of intermediate goods in the measure of GDP?
Ans: To avoid the problem of double counting.
15. If compensation of employees in a firm constitutes 65% of net value added at factor cost of a firm, find the proportion of operating surplus.
Ans: 100% – 65% = 35% (assuming mixed income is zero).
16. What is nominal gross domestic product? [CBSE Delhi 2011]
Ans: When gross domestic product (GDP) of a given year is estimated on the basis of price of the same year, it is called nominal GDP.
17. Define primary sector.[CBSE AI2013,]
Ans: It is the sector that produces goods by exploiting natural resources like land, water, forests, mines, etc. This sector includes agricultural and allied activities, fishing, mining and quarrying.
18. Define secondary sector.
Ans: It is called manufacturing sector also. Enterprises in this sector transform one type of commodity into another type of commodity. For example: leather goods from leather, flour from wheat, sugar from sugarcane, etc.
19. Define tertiary sector.
Ans: It is known as service sector also. Enterprises in this sector produce services only. Examples are banking, transport, communications etc.
II.MULTIPLE CHOICE QUESTIONS (1 Mark)
1. Which one of the following statements is incorrect?
(a) GDP at market price = GDP at factor cost plus net indirect taxes.
(b) NNP at factor cost = NNP at market price minus indirect taxes.
(c) GNP at market price = GDP at market price plus net factor income from abroad.
(d) None of them.
Ans: (a)
2. National income differs from net national product at market price by the amount———–.
(a) current transfers from the rest of the world
(b) net indirect taxes
(c) national debt interest
(d) it does not differ
Ans: (b)
3. Net national product at factor cost is————-.
(a) equal to national income
(b) less than national income
(c) more than national income
(d) sometimes less than national income and sometimes more than it
Ans: (a)
4. The net values added method of measuring national income is also known as—————-.
(a) net output method
(b) production method
(c) industry of origin method
(d) all of the above
Ans: (d)
5. Identify the item which is not a factor payment:
(a) Free uniforms to defense personnel
(b) Salaries to the members of Parliament
(c) Imputed rent of an owner occupied a building .
(d) Scholarships given to the students of scheduled caste
Ans: (d)
6. Mixed income of the self-employed means
(a) gross profits received by proprietors
(b) rent, interest and profit of an enterprise
(c) combined factor payments which are not distinguishable
(d) wages due to family workers
Ans: (c)
7. Demand for final consumption arises in ——————-.
(a) household sector only
(b) government sector only
(c) both household and government sectors
(d) neither in households nor in government sector
Ans: (c)
8. Demand for intermediate consumption arises in—————— .
(a) consumer households
(b) government enterprises only
(c) corporate enterprises only
(d) all producing sectors of an economy
Ans: (d)
9. Which one of the following options is an economic activity?
(a) Listening to music on the radio.
(b) Teaching one’s own son at home.
(c) Medical facilities rendered by a charitable dispensary.
(d) A housewife doing household duties.
Ans: (c)
10. Net value added is equal to—————– .
(a) payments accruing to factors of production
(b) compensation to employees
(c) wages plus rents
(d) value of output minus depreciation
Ans: (a)
11. Per capita national income means:
(a) NNP/population
(b) Total capital population
(c) Population NNP
(d) None of them
Ans: (a)
12. Which one of the following statements is correct?
(a) If national income rises, per capita income must also rise
(b) If population rises, per capita income must fall.
(c) If national income rises, welfare of the people must rise.
(d) None of them
Ans: (d)
III. SHORT ANSWER TYPE QUESTIONS (3-4 Marks)
1. Distinguish between domestic product and national product. When can domestic product be more than national product? [CBSE (Al) 2009]
OR
Differentiate between Domestic Income (NDPFC) Vs National Income (NNPFC).
Ans: 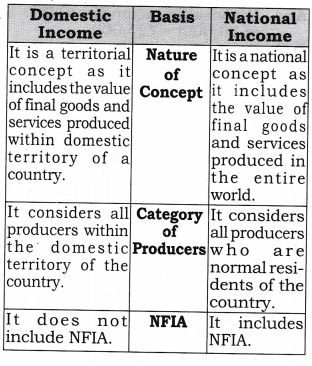
Domestic product will be greater than national product when net factor income from abroad is negative.
2. Differentiate between Gross Domestic Product at Market Price Vs National Income.
Ans: 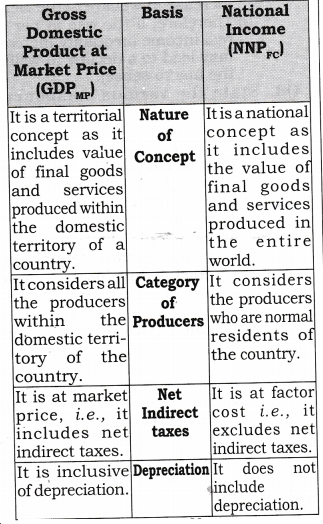
3. Differentiate between National Income at constant price and national income at current price?
Ans: 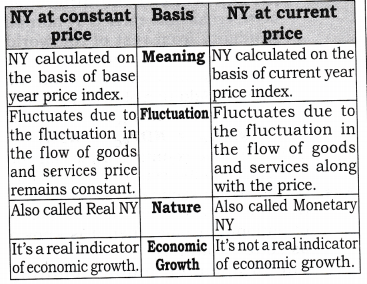
4. Distinguish between real and nominal gross domestic product.[CBSE(AI) 2010]
Or
Discuss any two differences between GDP at constant prices and GDP at current Prices.[CBSE Sample Paper 2016]
Ans: 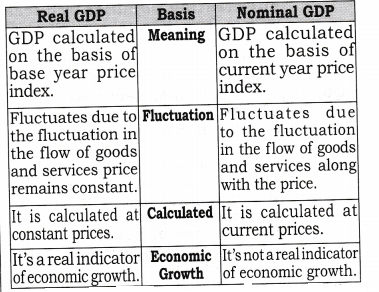
5. Explain how ‘externalities’ are a limitation of taking gross domestic product as an index of welfare. [CBSE Foreign 2011]
Ans:
- When the activities of somebody result in benefits or harms to others with no payment received for the benefit and no payment made for the harm done, such benefits and harms are called externalities.
- Activities resulting in benefits to others are positive externalities and increase welfare; and those resulting in harm to others are called negative externalities, and thus decrease welfare.
- GDP does not take into account these externalities.
- For example, construction of a flyover or a highway reduces transport cost and journey time of its users who have not contributed anything towards its cost. Expenditure on construction is included in GDP but not the positive externalities flowing from it. GDP and positive externalities both increase welfare. Therefore, taking only GDP as an index of welfare understates welfare. It means that welfare is much more than it is indicated by GDP.
- Similarly, GDP also does not take into account negative externalities. For examples, factories produce goods but at the same time create pollution of water and air. River Yamuna, now a drain, is a living example. The pollution harms people. The factories are not required to pay anything for harming people. Producing goods increases welfare but creating pollution reduces welfare. Therefore, taking only GDP as an index of welfare overstates welfare. In this case, welfare is much less than indicated by GDP.
6. Explain how “Non-Monetaiy exchanges’ are a limitation in taking gross domestic product as an index of welfare.[CBSE(AI) 2011]
Ans:
- There are many goods and services which are left out of estimation of national income on account of practical estimation difficulties e.g., services of housewives and other members, own account production, etc.
- These are left on account of non¬’ availability of data and problem in valuation.
- It is generally agreed that these items contribute to economic welfare.
- So, if we depend only on GDP, we would be underestimating economic welfare.
7. Explain how distribution of ‘Gross Domestic Product’ is a limitation in taking gross domestic product as an index of welfare.[CBSE Delhi 2010, 2011]
Ans:
- All people do not earn the same amount of income. Some earn more and some earn less. In other words, there is unequal distribution of income.
- At the same time, it is also true that in the event of rise in ‘per capita real income’ all are not better off equally. ‘Per capita’ is only an average. Income of some may rise by less and of some by more than the national average. In case of some it may even fall.
- It means that the inequality in the distribution of income may increase or decrease.
- If it increase it implies that rich become more rich and the poor become more poor.
- Utility of a rupee of income to the poor is more than to the rich. Suppose, the income of the poor declines by one rupee and that of the rich increases by one rupee. In such a case, the decline in welfare of the poor will be more than the increase in welfare of the rich.
- Therefore, if the rise in per capita real income inequality increases, it may lead to a decline in welfare (in the macro sense).
8. State the various components of the income method that are used to calculate national income.[CBSE Sample Paper 2014]
Ans:
- Compensation of employees: The amount earned by employees from their employer, whether in cash or in kind or through any other social security scheme is known as compensation of employees.
- Operating Surplus: It is the sum of income from property and income from entrepreneurship.
- Mixed Income: Income of own account workers (like farmers, doctors, barbers, etc.) and unincorporated enterprises (like small shopkeepers, repair shops) is known as mixed income.
Note: (i) To estimate amount of factor payments made by each producing unit.
(ii) To add all factor incomes/payments within domestic territory to get domestic income, i.e., NDPFC.
NDPFC = Compensation of employees + Operating Surplus + Mixed Income - Net factor income from Abroad(NFIA): NFIA is the difference between income earned by normal residents from rest of the world and similar payments made to Non residents within the domestic territory. Addition of NFIA to NDPFC to get NY, i.e., NNPpc.
NNPFC = NDPFC + NFIA
9. Define double counting. How can the problem of double counting be avoided?
Ans: If a single transaction is recorded twice or more than twice in the calculation of national income, then it is known as double counting.
The problem of double counting is solved by value added method. Theoretically to avoid double counting there may be two alternative ways:
- Final Product Approach
- Value Added Approach
- Final Product Approach: According to this, value of only final products, i.e. which go for final consumption or capital formation should be included. But in practical application of this approach double counting still creeps in as every producer treats the product he sells as final whereas the same might have been used as intermediate product by the buyer.
- Value Added Approach: Value added method is most effective in avoiding double counting. According to this, instead of taking value of final goods, only value added at each stage of production by a producing unit is taken. Value added of a firm by subtracting intermediate consumption from value of output.
IV. TRUE OR FALSE
Giving reasons, state whether the following statements are true or false.
1. In a closed economy, gross national product is always equal to gross domestic product.
Ans: True: When net factor income from abroad is zero i.e., income from abroad is equal to income to abroad.
2. Gross investment can be equal to net investment.
Ans: True: It is possible when depreciation is zero.
3. Domestic Income of a country can be more than its National income.
Ans: True: It can happen when NFIA is negative i.e., factor income paid to abroad is more than factor income received from abroad.
4. Market price is always more than factor cost.
Ans: False: Market price can be less than factor cost if net indirect taxes (NIT) are negative. Market price can also be equal to factor cost if NIT is zero.
5. Measurement of national income at current prices provides a reliable base of comparison.
Ans: False: National Income at ‘Constant Prices’ provides a reliable base of comparison.
6. Nominal GDP can never be less than Real GDP.[CBSE Sample Paper 2010]
Ans: False: Nominal GDP can be less than real GDP, if prices in the current year are less than the prices in the base year.
7. Net capital gains from the sale of property is a part of domestic factor income.
Ans: False: It is not a part of domestic factor income. It is. a sale of property and not of factors.
8. Change in stock is not a part of Capital formation.
Ans: False: Change in stock is a part of domestic capital formation.
9. Brokerage paid on sale of shares and income from shares purchased is not a part of national income.
Ans: False: Brokerage paid on sale of shares or any other item is a part of national income.
10. Salary of Pakistan worker, working in Indian Embassy is not a national income of India.
Ans: True: It is an expenditure made by- Indian Embassy. It is a part of Indian domestic income.
11. Income tax paid is not a part of national income.
Ans: False: Income tax paid is part of national income. It is included in profit and individual income.
12. Income from imputed rent of self- occupied houses is a part of national income.
Ans: True: It is an estimated amount of . rent. If rented to any other person, he would receive the amount of rent.
13. Net profit of any Bank of India’s branch in USA will not be included in Indian National income.
Ans: False: Net profit of any Bank of India at USA branch is a part of national income of India.
14. Exports do not form a part of domestic factor income.
Ans: False: Exports are made from domestic production. It is a part of domestic factor income.
15. Gross domestic product at market price includes net factor income from abroad and net indirect taxes.
Ans: False: GDPMP does not include net factor income from abroad but includes net indirect taxes.
16. Gross National Product is always less than Gross National expenditure.
Ans: False: Gross national product is always equal to gross national expenditure.
17. Exports are a part of net factor income from abroad.
Ans: False: Exports are a part of domestic income. Exports are sent from home production.
18. Real GDP includes domestic income at current prices.
Ans: False: Real GDP is taken at some constant prices. It does not have the influence of price fluctuations.
19. National disposable income includes current transfers income of government.
Ans: False: National income includes income of government sector in the form of receiving of taxes.
20. Private income does not include net factor income from abroad.
Ans: False: Private income is a national concept. It also includes net factor income from abroad.
21. Personal income does not include income from personal taxes.
Ans: False: Personal income includes personal taxes, but not corporate taxes.
22. Personal disposable income is equal to aggregate consumption and savings.
Ans: True: Personal disposable income can be disposed upon consumption and savings both.
23. Private income includes earned incomes of private sector from all sources.
Ans: False: Private income includes both earned income (factor income) as well as unearned income (transfer income) of private sector from all sources.
24. National disposable income is the disposable income of private sector.
Ans: False: It is the disposable income of the whole country (public sector and private sector).
25. Travelling allowance paid by employer is a part of national income.
Ans: False: Travelling allowances are paid by an employee and then recovered from employer. It is not a part of national income
26. Consumption of food grains by farmer himself is not a part of national output.
Ans: False: It is a part of domestic output. It is a part of national income.
27. Sale of second hand car is not included in national income.
Ans: True: It’s original sale has already been included in national income of previous year. If done it will be case of double counting.
28. Rent received by an American from Reliance Industries with respect to building located in India will neither be included in national income nor in domestic income of India.
Ans: False: Such rent will be included in domestic income of India as building is located within the domestic territory of India
29. Purchase of car by a consumer is a part of gross domestic capital formation.
Ans: False: It is a part of private final consumption expenditure.
30. Goods produced for self-consumption will be included in national income.
Ans: True: Such goods contribute to the current output and their imputed value will be included in national income.
31. Gross domestic capital formation is always greater than gross fixed capital formation. [CBSE Sample Paper 2010]
Ans: False: Gross domestic capital formation can be less than gross fixed capital formation if change in stock is negative.
Note: As per CBSE guidelines, no marks will be given if reason to the answer is not explained.
V. LONG ANSWER TYPE QUESTIONS(6 Marks)
1. Calculate GNP at FC from the following data by
- income method, and
- expenditure method. [CBSE 2002]
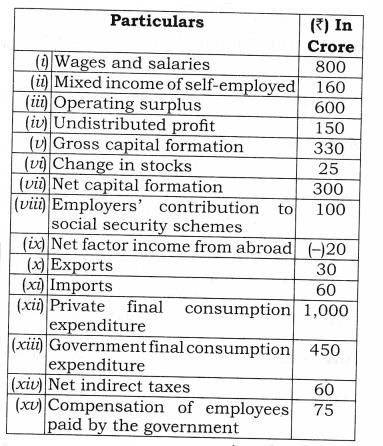
Ans:
- NDPFC = Compensation of employees (Wages and salaries + Employer’s contribution towards social security scheme) + Operating Surplus + Mixed Income
= [(i) + (viii)] + (iii) + (ii)
= [800 + 100] + 600 + 160 = 900 + 600 + 160 = 1660 Crore GNPFC = NDPFC + Depriciation (Gross capital formation – Net capital Formation) + Net Factor Income from abroad = 1660 + [(H) – (nil) + (6c)]
= 1660 + [330-300] + (-20)]
= 1660 + 30 – 20 = 1670 Crore - GDPMP = Government final consumption expenditure (Public final consumption expenditure) + Private final consumption expenditure + Gross domestic Capital formation + Net export (Export – Import)
= (xiii) + (xii) + (v) + [(x) – (xi)]
= 450 + 1000 + 330 + [30 – 60]
= 1750 Crore .
GNPFC = GDPMP + Net factor income from abroad – Net Indirect Tax = 1750 + (be) – (xiv)
= 1750 + (- 20) – 60 = 1750 – 20 – 60 = 1670 Crore
2.Calculate “Gross National Product at Factor Cost” from the following data by (a) Income method, and (b) Expenditure method:[CBSE 2009]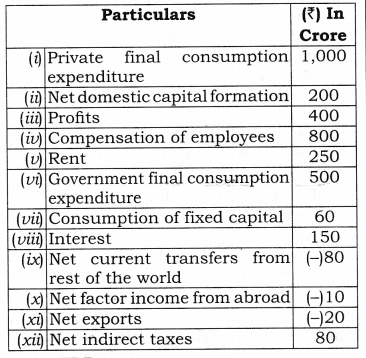
Ans: NDPFC = Compensation of Employees + Operating Surplus( profit + Rent + Interest + Mixed Income
= (iv) +[(iii) + (v) + (viii)] + 0 = 800 + [400 + 250 + 150]
= 800 + 800 = 1600 Crore GNPFC = NDPFC + Depreciation (Consumption of fixed Capital) + Net factor Income from abroad = 1600 + (vii) + (x)
= 1600 + 60 + (-10) = 1650 Crore GDPMP = Government final consumption expenditure + Private final consumption expenditure + Gross domestic capital formation (Net domestic capital formation + consumption of fixed capital) + Net export = (x) + (i) + [(ii) + (vii)] + (xi)
= 500 + 1000 + [200 + 60] + (- 20)
= 500 + 1000 + 260 – 20 = 1740 Crore GNPFC = GDPMP + Net factor income from abroad – Net Indirect Tax
= 1740 + (x) – (xii)
= 1740 + (-10] – 80 = 1650 Crore
3. From the following data, calculate (a) Gross Domestic Product at Factor Cost and (b) Factor Income To Abroad:[CBSE 2010]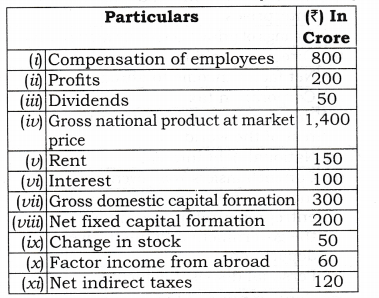
Ans: (a) NDPFC = Compensation of employees + Operating surplus (Profit + Rent + Interest) + Mixed income
= (i) + P) + (v) + M] + 0 = 800 + [200 + 150 + 100]
= 800 + 450 = 1250 Crore Note: Gross domestic capital formation = Net fixed capital formation + Depreciation + Change in stock (vii) = (viii) + Depreciation + (ix)
300 = 200 + Depreciation + 50 Depreciation = 300 – 250 = 50 GDPFC = NDPFC + Depriciation = 1250 + 50 = 1300 Crore (b) GNPMP = GDPFC + NFIA (Factor income from abroad – Factor income paid to abroad) + Net indirect tax (iv) = 1300 + [(x) – Factor income paid to abroad] + (xi)
1400 = 1300 + (60 – Factor income paid to abroad) + 120 1400 = 1480 – Factor income paid to abroad Factor income paid to abroad = 1480 – 1400 = 80 Crore
4. Calculate (a) Private Income and (b) Gross Domestic Product at Factor Cost: [CBSE 2013, C, Set-I]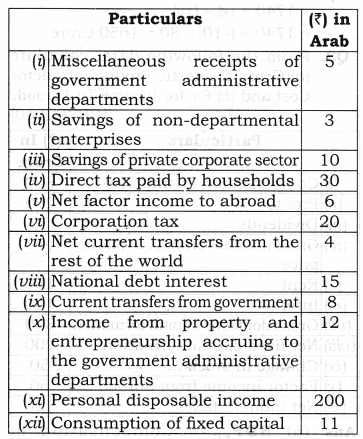
Ans: Personal Disposable Income = Personal income – Direct taxes paid by households – Miscellaneous receipts of government
(xi) = Personal Income – (iv) – (i)
200 = Personal income – 30 – 5 Personal Income = 235 Arab Private Income = Personal Income + Retained profits (Savings of private corporate sector) + Corporate Tax = 235 + (iii) + (ii)
= 235 + 10 + 20 = 265 Arab „ Private income = NNPFC – Income from Domestic Product Accruing to Public Sector (Income from Property and Entrepreneurship accruing to government Administrative Departments + Saving of Non Departmental Enterprises) + National Debt interest + Current transfers from Government + Net Current transfers from rest of the world ,
265 = NNPFC – [(x) + (ii)] + (viii) + (ix) + (vii) ]
265 = NNPFC – (12 + 3) + 15 + 8 + 4
NNPFC = 265 + 15 – 27 = 253 Arab
GDPFC = NNPFC + Consumption of fixed capital – Net factor income from abroad
= 253 + (xii) – [-(v)]
= 253 + 11 + 6 = 270 Arab
5. Calculate (a) Private Income and (b) National Income: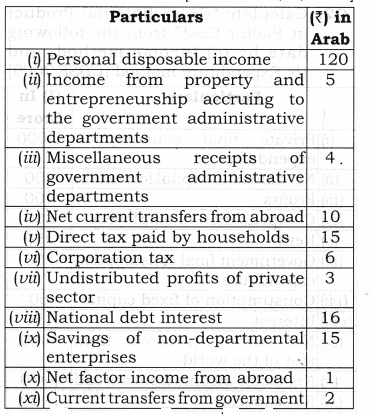
Ans: Personal Disposable Income =Personal Income – Direct Taxes paid by households – Miscellaneous receipts of Government
(i) = Personal Income -(v)- (iii)
120 = Personal income – 15 – 4 Personal Income =139 Arab (Billion) Private Income = Personal Income + Undistributed profits of private sector + Corporate Tax = 139 + (vii) + (vi)
= 139 + 3 + 6 = 148 Arab Private income = NNPFC – Income from Domestic Product Accruing to Public Sector (Income from Property and Entrepreneurship accruing to Government Administrative Departments + Saving of Non-Departmental Enterprises) + National Debt interest + Current transfers from government + Net Current transfers from rest of the world
148 = NNPFC – [(ii) + (ix)] + (viii) + (xi) + (iv) ,
148 = NNPFC-(5+ 15) + 16 + 2+ 10
NNPFC = 148 + 20 – 28 = 140 Arab
6. Find out Gross National Product at Market price and Net National Disposable Income from the following:
Ans: GDPMP = Government final consumption expenditure+Private final consumption expenditure + Gross domestic Capital formation (Net domestic Fixed capital formation + consumption of fixed capital + Change in stocks (closing stock – opening Stock) + Net Export = (vi) + (ii) + {(ix) + (vii) + [(iv) – (i)]} + (-viii) = 300+ 1000+ {150+ 30 + [40-50]}+ (-20) = 300 + 1000 + 170 – 20 = 1450 Arab GNPMP = GDPMP + Net factor income from abroad = 1450 + (-v)
= 1450 +[- (-10)] = 1460 Arab NNPFC = GNPMP – consumption of fixed capital – net indirect tax = 1460 – (vii) – 0 = 1460 – 30 = 1430 Arab
NNDI = NNPFC + NIT + Net current transfer from rest of the world (abroad) = 1430 + 0 + (-iii)
= 1430 + (-5) = 1425 Arab
VI. HIGHER ORDER THINKING SKILLS
1. Explain the components of NFIA.[3-4 Marks]
Ans: There are three components of NFIA.
- Net Compensation of Employees: The net compensation of employees receivable from the rest of the world is equal to the difference between compensation of employees received by resident workers who are living temporarily abroad or are employed abroad , and similar payments made to non- residents workers that are temporarily staying or are employed within the domestic territory of the country.
- Met Income From Property and Entrepreneurship: Net income from property and entrepreneurship is equal to the difference between the income received by way of interest, rent and profits by the residents of a country and similar payments made to the rest of the world.
- Net Retained Earnings of Resident Companies Abroad: Retained earnings refers to the undistributed profits of the companies. Resident companiesft.e. companies belonging to one country and working in the domestic territory of some other country) retain a part of their profits for further investment abroad. Likewise, foreign companies and their branches retain a part of their profits in the countries of their operation.
The difference between the retained earnings of resident companies located abroad and retained earnings of the foreign companies located in a country is equal to the net retained earnings from abroad.
Note: It must be noted that NFIA is zero in a closed economy as such economy does not deal with the rest of the world sector.
2. Differentiate between National income and Private income. [3-4 Marks]
Ans: 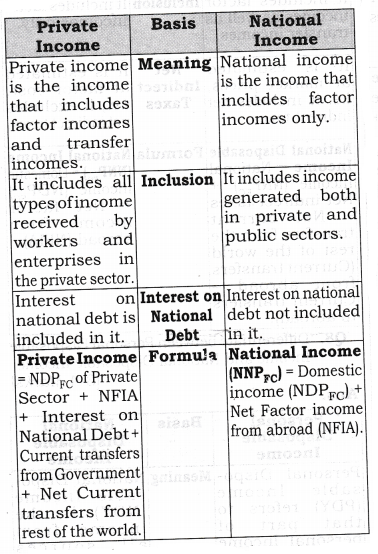
VII. VALUE BASED QUESTIONS
1. Why do non market economic activities, like
- Services of housewives
- Voluntary services and
- Leisure time activities
help in the flow of goods and services of a country. But why are these not included in the estimation of national income? [ 1 Mark]
Ans: They are not included in national income, because of non-availability of data and problem in measuring the proper monetary values of these services.
Value : Implication of knowledge.
2. The given set of prices which is used for finding out real per capita income, should change frequently. Why? [ 1 Mark]
Ans: If the given set of prices used for assessing real per capita income changes frequently, then virtually what we get is nominal per capita income and this defeats the purpose of using or calculating the real per capita income.
Value : Critical thinking
3. Why comparing the GDPs of various nations might not tell you which nation is better off? [ 1 Mark]
Ans: The well being of nation or standard of living of people is measured by per capita income (GDP / Total Population) and distribution pattern of income not only by GDP.
Value : Critical thinking
4. GDP Calculation do not directly include the social costs of environmental damages, for example, global warming, acid rain. Do you think these costs should be included in GDP? Why or Why not? [ 1 Mark]
Ans:Yes, because people’s well-being is affected by these environmental damages. No, it is very difficult to assess real damages in monetary terms.
Value : Awareness about social cost of GDP.
5. GDP growth rate in India for the last few years is more than 6% but still more than 28% of population is lying below poverty line. Explain any two factors responsible for it. [ 1 Mark]
Ans:There are two factors,
- Unequal distribution of GDP
- Rise in price level Value : Social awareness
6. Should we take real per capita income as an index of economic welfare? If not, why? [1 Mark]
Ans:Real per capita income cannot be taken as an index of economic welfare because there are many items and transactions relating to national income that have no connection with real GDP such as production of defence goods. Also it does not take into account any transaction related to illegal activities, black money and production of services for self-consumption.
Value : Critical thinking
7. Rakesh pays Rs 1,000 towards premium on his full life policy with the LIC. Is this a part of compensation of employees? [1 Mark]
Ans: No, any contribution made by an employee himself to any insurance scheme is not a part of compensation to employee. Value: Analytic
8. How will you treat Rs 20,000 earned per month by Mr Rajesh against hiring out his bus to a neighboring school?[1 Mark]
Ans: Income earned by way of lease is rental income, and hence form part of operating surplus and is included in national income.
Value: Analytic
Class 12 Macro Economics Chapter-3 Money
1. What is Barter system? What are its drawbacks? [3 Marks]
Ans:Barter system of exchange is a system in which goods are exchanged for goods.
It’s Drawbacks are:
- Lack of double coincidence of wants.
- Lack of divisibility.
- Difficulty in storing wealth.
- Absence of common measure of value.
- Lack of standard of deferred payment.
2. What are the main functions of money? How does money overcome the shortcoming of a barter system?
[6 Marks] Or
Explain the problem of double coincidence of wants faced under barter system. How has money solved it? [CBSE 2013 ]
Ans:
- “Money is a matter of the following four functions: A medium, a measure, a standard, a store”.
- Money has overcome the short¬coming of a barter system in the following manner:
(a) Medium of exchange
• Under barter system, there is lack of double coincidence of wants.
• With money as a medium exchange individuals can exchange their goods and services for money and then use this money to buy other goods and services according to their needs and conveniences.
• A buyer can buy goods through money and a seller can sell goods for money.
(b) Measure of value
• Under barter system, there was no common measure of value. Money has also solved this difficulty.
• As Geoffrey Crowther puts it, “Money acts as a standard measure of value to which all other things can be compared.” Money measures the value of economic goods.
• Money works as a common denominator into which the values of all goods and services are expressed.
• When we express the values of a commodity in terms of money, it is called price and by knowing prices of the various commodities, it is easy to calculate exchange ratios between them.
(c) Store of value
• Under barter system it is very difficult to store wealth for future use.
• Most of the goods are perishable and their storage requires huge space and transportation cost.
• Wealth can be conveniently stored in the form of money.
• Money can be stored without loss in value.
• Money can easily be stored for future use.
(d) Standard of deferred payments
• Under barter system, transactions on deferred payments are not possible.
• With money, the debtors make a promise that they will make payments on some future dates. In those situations money acts as a standard of deferred payments.
• It has become possible because money has general acceptability, its value is stable, it is durable and homogeneous.
3. What is transaction demand for money? How is it related to the value of transactions over specified period of time?
Ans: Deleted from syllabus.
4. Why is speculative demand for money inversely related to the rate of interest?
Ans:Deleted from syllabus
5. What are the alternative definitions of money supply in India?[3-4 Marks]
Ans: The alternative definitions of money supply in India can be the four measures of money supply. They are explained as under:
Measures of M1 include:
- Currency notes and coins with the public (excluding cash in hand of all commercial banks) [C]
- Demand deposits of all commercial and co-operative banks excluding inter-bank deposits. (DD),
Where demand deposits are those deposits which can be withdrawn by the depositor at any time by means of cheque. No interest is paid on such deposits. - Other deposits with RBI [O.D]
M1 = C + DD + OD Where, Other deposits are the deposits held by the RBI of all economic units except the government and banks. OD includes demand deposits of semi-government public financial institutions (like IDBI, IFCI, etc.), foreign central banks and governments, the International Monetaiy Fund, the World Bank, etc.
Measures of M2
- M1[C + DD + OD]
- Post office saving deposits
Measures of M3
- M1
- Time deposits of all commercial and co-operative banks.
Where, Time deposits are the deposits that cannot be withdrawn before the expiry of the stipulated time for which deposits are made. Fixed deposit is an example of time deposit.
Measures of M4
- M3
- Total deposits with the post office saving organization (excluding national savings certificates).
6. What is a ‘legal tender’? What is ‘fiat money’?
Ans:
- Legal tender:
(a) Legally, money is anything proclaimed by law as a medium of exchange.
(b) Paper notes and coins (together called currency) is money as a matter of law.
(c) Nobody can refuse its acceptance as medium of exchange. - FIAT Money: It is defined as a money which is under the ‘FIAT’ (order/authority) of the government to act as a money.
7. What is High powered money?
Ans: It is money produced by the RBI and the government. It consists of two things:
- currency held by the public and
- Cash reserves with the banks.
MORE QUESTIONS SOLVED
I.VERY SHORT ANSWER TYPE QUESTIONS (1 Mark)
1. Define Barter system.
Ans: Barter system of exchange is a system in which goods are exchanged for goods.
2. What is meant by double coincidence of wants?
Ans: Double coincidence of wants means that goods in possession of two different persons must be useful and needed by each other.
3. Define Money.
Ans:Money is something which is generally acceptable as a medium of exchange and can be converted into other assets without loosing its time and value.
4. What is the basic characteristic of money?
Ans: Durability and weight.
5. What is the legal definition of money?
Ans: Legally, money is anything proclaimed by law as a medium of exchange. Paper notes and coins (together called currency) is money as a matter of law.
6. Define money supply.[CBSE Foreign 2004, 2031]
Ans: The stock of money held by the public at a point of time, in an economy,
is referred to as the money supply. Money supply is a stock concept.
7. What items are included in the M3 measure of money supply?
Ans:
- M3(currency notes and coins with public + demand deposits of commercial and co-operative banks + other deposits with RBI),
- Time deposits of all commercial and co-operative banks.
8. State two components of money supply. [CBSE Sample Paper 2010] Or
State the components of money supply. Or [CBSE 2010]
What is included in money supply?[CBSE 2010C, 2011]
Ans:Currency notes and coins with public + demand deposits with the banks.
9. Define demand deposits.[CBSE 2013, Set I, HOTS ]
Ans: Demand deposits are those deposit which can be withdrawn by the depositor at any time by means of cheque. No interest is paid on such deposits.
10. What are time deposits in banks?[AI 2013, C Set I]
Ans: Time deposits are the deposits which can not be withdrawn before the expiry of the stipulated time for which deposits are made. Fixed deposit is an example of time deposit.
11. State the components of supply of money. [AT 2013 Set I]
Ans:
- Coins and currency notes with public.
- Demand deposits with banks.
II.MULTIPLE CHOICE QUESTIONS(1 Mark)
1. M1 in the money stock in India refers to:
(a) Post office savings deposits.
(b) Total post office deposits.
(c) Currency plus demand deposits plus other deposits with the RBI.
(d) Time deposits with banks.
Ans:(c)
2. Narrow money refers to:
(a) M1 (b) M2
(c) M3 (d) M4
Ans: (a)
3. Broad money refers to:
(a) M1 (b) M2
(c) M3 (d) M4
Ans: (c)
4. The basic distinction between narrow and broad money is the
(a) treatment of post office deposits
(b) treatment of time deposits of banks
(c) treatment of savings deposits of banks
(d) treatment of currency
Ans:(b)
5. Read the following dialogue between two people:
Sita : I want 1 kg of potatoes
Rani : What will you give in exchange?
Sita : I can give you 2 litres of milk in return for the potatoes.
Rani: I don’t need milk. I want a pair of shoe
Which of the following problems is being faced by Sita and Rani in their exchange process?
(a) Lack of double coincidence of wants
(b) Absence of common units of value
(c) Lack of store of value
(d) Lackl of standard of deferred payment.
Ans: (a)
6. Which of the following agency is responsible for issuing ? 1 currency note in India?[CBSE Sample Paper 2016]
(a) Reserve Bank of India
(b) Ministry of Commerce
(c) Ministry of finance
(d) Niti Aayog
Ans:(c)
SHORT ANSWER TYPE QUESTIONS [3-4 Marks]
1. Explain the ‘medium of exchange’ function of money.[CBSE Delhi 2014, AI 2013]
Ans:
- Money when used as a medium of exchange helps to eliminate the basic limitation of barter trade, that is, the lack of double coincidence of wants.
- Individuals can exchange their goods and services for money and then can use this money to buy other goods and services according to their needs and convenience.
- Thus, the process of exchange shall have two parts: a sale and a purchase.
- The ease at which money is converted into other goods and services is called “liquidity of money”.
2. Explain the ‘ Unit of account’ function of money. [CBSE 2004C; AI 2007]
Ans:
- Another important function of money is that it serves as a common measure of value or a unit of account.
- Under barter economy there was no common measure of value in which the values of different goods could be measured and compared with each other. Money has also solved this difficulty.
- As Geoffrey Crowther puts it, “Money acts as a standard measure of value to which all other things can be compared.” Money measures the value of economic goods.
- Money works as a common denominator into which the values of all goods and services are expressed.
- When we express the values of a commodity in terms of money, it is called price and by knowing prices of the various commodities, it is easy to calculate exchange ratios between them.
3. Explain Standard of deferred payments function of money.[CBSE Delhi 2004 C, 2007, 2012, Sample Paper 2013]
Ans:
- Credit has become the life and blood of a modem capitalist economy.
- In millions of transactions, instant payments are not made.
- The debtors make a promise that they will make payments on some future date. In those situations money acts as a standard of deferred payments.
- It has become possible because money has general acceptability, its value is stable, it is durable and homogeneous.
4. Explain Store of value function of money.[CBSE 2006, 2006C, 2007; AI 2007, 2013 C, Sample Paper 2013]
Ans:
- Wealth can be conveniently stored in the form of money. Money can be stored without loss in value.
- Savings are secured and can be used whenever there is a need.
- In this way, money acts as a bridge between the present and the future.
- Money means goods and services. Thus, money serves as a store of value.
- It is also known as asset function of money.
5. Explain the problem of double coincidence of wants faced under barter system. How has money solved it? [CBSE 2013 (Set-I)]
Ans:
- Under barter system, there is lack of double coincidence of wants.
- With money as a medium exchange individuals can exchange their goods and services for money and then use this money to buy other goods and services according to their needs and conveniences.
- A buyer can buy goods through money and a seller can sell goods for money.
IV.TRUE OR FALSE
Giving reasons, state whether the following statements are true or false.
1. Standard of deferred payments led to capital formation and economic development of the economy.
Ans: True. It is so because credit has become the life and blood of a modem capitalist economy that leads to economic development of the country.
2. Measure of value function has removed the difficulty of lack of double coincidence of wants.
Ans: False. Medium of exchange function has removed the difficulty of lack of double coincidence of wants.
3. Store of value function of money facilitates transfer of purchasing power from present to future.
Ans: True. It facilitates transfer of purchasing power from present to future.
4. Money supply is a stock concept.
Ans: True. Money supply is a ‘stock concept’ as it is measured at a particular point of time.
5. M1 includes time deposits of commercial banks.
Ans: False. M1 includes currency notes and coins, demand deposits of commercial and cooperative banks and other deposits. Time deposit is a component of M3.
6. Money supply does not include money held by government and banking system.
Ans: True. As money held by them do not come into actual circulation in the country.
7. Lack of double coincidence of wants exists in barter exchange difficulty in simultaneous fulfilment of mutual wants of buyers and sellers.
Ans: True. It exists under barter exchange because of difficulty in simultaneous fulfilment of mutual wants of buyers and sellers.
Note: As per CBSE guidelines, no marks will be given if reason to the answer is not explained.
V. HIGHER ORDER THINKING SKILLS
1. Define high-powered money. [ 1 Mark]
Ans: High-powered money is money produced by the RBI and the government. It consists of two things:
- Currency held by the public and
- Cash reserves with the banks.
2. What are other deposit measures of M1? [1 Mark]
Ans: Other deposits are the deposits held by the RBI of all economic units except the government and banks. OD includes demand deposits of semi-government public financial institutions (like IDBI, IFCI, etc.), foreign central banks and governments, the International Monetary Fund, the World Bank, etc.
3. Why post office saving are less liquid than demand deposits? [1 Mark]
Ans: Post office saving banks are not as liquid as demand deposits with the banks (commercial or cooperative) as they are not chequeable account. However, saving deposits with post offices are more liquid than time deposits with the banks.
4. Explain why time deposits measures of M3 is less liquid than the demand deposits measure of Mr [3 Marks]
Ans:
- It is generally thought that time deposits with the banks are not as liquid as demand deposits, because the time deposits are not chequeable (i.e., these cannot be withdrawn through cheques drawn on them).
- However, loans against these time deposits can be easily taken. Hence, they can be used in times of need.
- Moreover, they can also be withdrawn at any time by forgoing some interest earned on them.
5. What are the characteristics or features of money? [3 Marks]
Ans:
- Durability: Money must be durable and not likely to deteriorate rapidly with frequent handling. Currency notes and coins are being used repeatedly and shall continue to do so for many years.
- Medium of exchange: Money is the thing that acts as a medium of exchange for the sale and purchase of goods and services.
- Weight: Money must be light in weight. Paper money is better than metal coins because it is light in weight.
- Measure of value: It not only serves as medium of exchange but also acts as a measure of value. The value of all the goods and services is expressed in terms of money. [ 1 Mark]
VI. VALUE BASED QUESTIONS
1. Why is the use of money more convenient for exchange than barter system? Explain. [3 Marks]
Ans:
- Medium of Exchange
- Store of Value
- Standard of deferred payment Value: Empathy
2. Why do all the compensations in form of money than toys more convenient to an employee working in a toy manufacturing factory? [1 Mark]
Ans: There is lack of general acceptability in case of toys, while in the case of money there is general acceptability; so, he can purchase any goods and services with the help of money at any point of time and he does not have to face any problem of lack of double coincidence of wants.
Value: Empathy
Class 12 Macro Economics Banking
VERY SHORT ANSWER TYPE QUESTIONS (1 Mark)
1. Define commercial bank.
Ans:Commercial bank is a financial institution which performs the functions of accepting deposits from the public and making loans and investments, with the motive of earning profit.
2. Define money multiplier/credit multiplier/deposit multiplier.
Ans:When the primary cash deposit in the banking system leads to multiple expansion in the total deposits, it is known as money multiplier or credit multiplier.
3. Define central bank. [CBSE 2008, 09; A 08]
Ans: The central bank is the apex institution of a country’s monetary system. The design and the control of the country’s monetary policy is its main responsibility. India’s central bank is the Reserve Bank of India.
4. Define bank rate. [CBSE 2009]
Ans:It is the rate of interest at which central bank lends to commercial banks without any collateral (security for purpose of loan).
5. What will be the effect of a rise in bank rate on the money supply? [CBSE Sample Paper 2008]
Ans: Money supply will reduce.
6. Define open market operations.
Ans: It consists of buying and selling of government securities and bonds in the open market by central bank.
7. What is meant by cash reserve ratio? [CBSE 2011, CBSE Sample Paper 2008, 2013]
Ans: Cash Reserve Ratio refers to the minimum percentage of a bank’s .total deposits, which it is required to keep with the central bank.
8. What is meant by statutory liquidity ratio? [CBSE Sample Paper 2010]
Ans: It refers to minimum percentage of net total demand and time liabilities,
which commercial banks are required to maintain with themselves.
II. MULTIPLE CHOICE QUESTIONS (1 Mark)
1. Which one of the following institutions is not a bank?
(a) HDFC (b) LIC
(c) UTI (d) All of them
Ans:(d)
2. Quantitative instrument of RBI can be:
(a) Bank Rate policy
(b) Cash Reserve Ratio
(c) Statutory Liquidity Ratio
(d) All of them
Ans: (d)
3.refers to that portion of total deposits of a commercial bank which it has to keep with RBI in the form of cash reserves.
(a) CRR (b) SLR .
(c) Bank Rate (d) Repo Rate
Ans: (a
4.refers to that portion of total deposits of a commercial bank which it has to keep with itself in the form of liquid assets.
(a) CRR (b) SLR
(c) Bank Rate (d) Repo Rate
Ans: (b)
5. In order to control credit in the country, the RBI may
(a) buy securities in the open market
(b) sell securities in the open market
(c) reduce CRR
(d) reduce bank rate
Ans: (b)
6. In order to encourage investment in
the country, the RBI may
(a) reduce CRR. (b) increase CRR.
(c) sell securities in the open market.
(d) increase bank rate.
Ans: (a)
7. In order to discourage investment in the economy, the RBI may
(a) Increase bank rate
(b) decrease bank rate
(c) buy securities in the open market
(d) decrease CRR
Ans: (a)
8. The effect of increase in CRR will be
reduced or nullified if
(a) bank rate is reduced
(b) securities are sold in the open market
(c) SLR is increased
(d) people do not borrow from non-banking institutions
Ans: (a)
9. In order to control credit
(a) CRR should be increased and bank rate should be decreased
(b) CRR should be reduced and bank rate should be reduced
(c) CRR should be increased and bank rate should be increased
(d) CRR should be reduced and bank rate should be increased
Ans: (c)
10. controls affect indiscriminately all sectors of the economy.
(a) Selective credit
(b) Quantitative
(c) Margin requirements
(d) None of the above
Ans: (b)
11. During depression, it is advisable to
(a) lower bank rate and purchase securities in the market
(b) increase bank rate and purchase securities in the open market
(c) decrease bank rate and sell securities in the open market.
(d) increase bank rate and sell securities in the open market
Ans: (a)
12. The ‘lender of last resort’ means
(a) the government coming to the rescue of poor farmers.
(b) Central Bank coming to the rescue of other banks in times of financial crisis.
(c) commercial banks coming to the rescue of small industrial units.
(d) None of them.
Ans: (b)
13. Who is called the ‘bank of issue’?
(a) RBI (b) SBI
(c) IDBI (d) ICICI
Ans: (a)
14. Who is the fiscal agent and adviser to government in monetary and financial matters in India?
(a) SBI (b) IDBI
(c) ICICI (d) RBI
Ans: (d)
15. Who is the custodian of national reserves of international currency?
(a) SBI (b) IDBI
(c) RBI (d) ICICI
Ans: (c)
SHORT ANSWER TYPE QUESTIONS[3-4 Marks]
1. Explain issue of currency function of Central Bank.
[CBSE 2004C, 06; AI 11] Or
Explain the “Bank of Issue Function” of the central Bank.[CBSE, AI 2015]
Ans:
- The central bank has the sole monopoly to issue currency notes. Commercial banks cannot issue currency notes. Currency notes issued by the central bank are the legal tender money.
- Legal tender money is one, which every individual is bound to accept by law in exchange for goods and services and in the discharge of debts.
- Central bank has an issue department, which is solely responsible for the issue of notes.
- However, the monopoly of central bank to issue the currency notes may be partial in certain countries.
- For example, in India, one rupee notes and all coins are issued by the government and all other notes are issued by the Reserve Bank of India.
2. Explain banker to the government function of a Central Bank.[CBSE 2013, 06C; AI 08; 10]
Or
Explain “Government’s Bank” function of Central Bank.[CBSE 2015]
Ans: As a banker to the government, the central bank performs same functions as performed by the commercial banks to their customers.
- It receives deposits from the government and collects cheques and drafts deposited in the government account.
- It provides cash to the government as resumed for payment of salaries and wages to their staff and other cash disbursements.
- It makes payments on behalf of the government.
- It also advances short term loans to the government.
- It supplies foreign exchange to the government for repaying external debt or making other payments.
3. Explain the “banker’s bank ’ function of a central bank.[Al 2015, 2007, 11, CBSE 13, Al]
Ans: Central bank acts as the banker to the banks in three ways :
- custodian of the cash reserves of the commercial banks;
- as the lender of the last resort; and
- as clearing agent.
- As a custodian of the cash reserves of the commercial banks, the central bank maintains the cash reserves of the commercial banks. Every commercial bank has to keep a certain percent of its cash reserves with the central bank by law.
- As Lender of the Last Resort.
(a) As banker to the banks, the central bank acts as the lender of the last resort.
(b) In other words, in case the commercial banks fail to meet their financial requirements from other sources, they can, as a last resort, approach to the central bank for loans and advances. - The central bank assists such banks through discounting of approved securities and bills of exchange.
(c) As Clearing Agent
(i) As the custodian of the cash reserves of the commercial banks, the central bank acts as the clearing house for these banks.
(ii) Since all banks have their accounts with the central bank, the central bank can easily settle the claims of various banks against each other simply by book entries of transfers from and to their accounts.
(iii) This method of settling accounts is called Clearing House Function of the central bank.
4. How does central bank control availability of credit by open market operations?[CBSE 2005, 06C, 11C; AT 04, 10]
Ans:
- Open Market Operation consists of buying and selling of government securities and bonds in the open market by central bank.
- To control availability of credit, central bank sells government securities and bonds to commercial bank.
- With the sale of these securities, the power of commercial banks of giving loans decreases.
5. What is Legal Reserve Ratio? Explain its components. [AI 2013, C (Set 1)]
Ans:
- Legal Reserve Ratio: It is the minimum ratio of deposits legally required to be kept by the commercial banks with themselves and with the central bank.
- It’s components are:
(a) Cash Reserve Ratio: It refers to the minimum percentage of a bank’s total deposits, which it is required to keep with the central bank.
(b) Statutory Liquidity Ratio: It refers to minimum percentage of net total demand and time liabilities, which commercial banks are required to maintain with themselves.
6. Differentiate between central bank and commercial bank.
Or
State any three points of distinction between central bank and commercial bank.[CBSE 2009]
Ans: 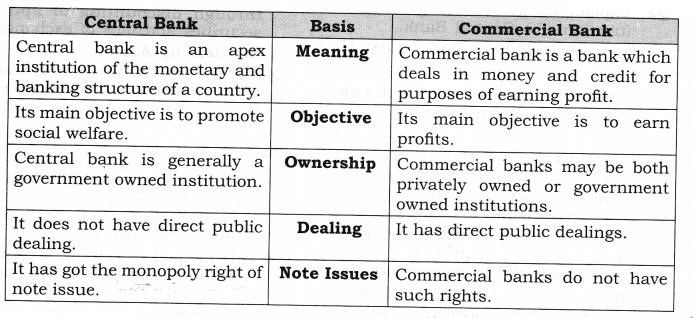
IV.TRUE OR FALSE
Giving reasons, state whether the following statements are true or false.
1. Increase in statutory liquidity ratio adversely affects the capacity of commercial banks to create credit.
Ans: True. An increase in statutory liquidity ratio reduces the excess reserves of commercial banks and limits their credit creating power.
2. Sale of securities in the open market by the commercial banks reduces their crediting power.
Ans: False. Purchase of securities decreases the reserves of commercial banks, which reduces their crediting power, not the sale of securities in the open market.
3. Cash reserve ratio and statutory liquidity ratio are fixed by the central bank.
Ans: True. They are fixed by central bank under quantitative instruments of credit control.
4. Under marginal requirement, the Reserve Bank of India gives directions to other banks to channelise credit to priority sectors.
Ans: False. It happens under selective credit controls.
5. There is an inverse relationship between legal reserve ratio (LRR) and value of money multiplier.
Ans: True. Money multiplier is inversely related to LRR as Money Multiplier
6. To increase the money supply in the economy central bank increases the margin requirements.
Ans: False. Rise in margin requirements discourages the borrowing capacity of public which decreases the money supply in the economy.
V.LONG ANSWER-TYPE QUESTION(6 Marks)
1. (i) What is meant by Cash Reserve Ratio? How does it increase the money Supply in the economy? (ii) What is meant by Open Market Operation? How does it reduce the money supply in the economy?[CBSE Sample Paper 2014][(3 + 3)]
Ans:
- Cash Reserve Ratio:
(a) It refers to the minimum percentage of a bank’s total deposits, which it is required to keep with the central bank. Commercial banks have to keep with the central bank a certain percentage of their deposits in the form of cash reserves as a matter of law.
(b) For example, if the minimum reserve ratio is 10% and total deposits of a certain bank is ?100 crore, it will have to keep Rs 10 crore with the central bank.
(c) To increase Money supply in an economy, cash reserve ratio (CRR) falls to 5 per cent, the bank will have to keep Rs 5 crore with the central bank, which will increase the cash resources of commercial bank and increasing credit availability in the economy, which will increase the money supply in an economy. - Open Market Operation:
(a) It consists of buying and selling of government securities and bonds in the open market by central bank.
(b) To reduce Money Supply in an economy, central bank sells government securities and bonds to commercial bank. With the sale of these securities, the power of commercial bank of giving loans decreases, which will reduce the money supply in an economy.
VI. HIGH ORDER THINKING SKILLS
1. Differentiate between quantitative and qualitative instruments of credit control. [3 Marks]
Ans: 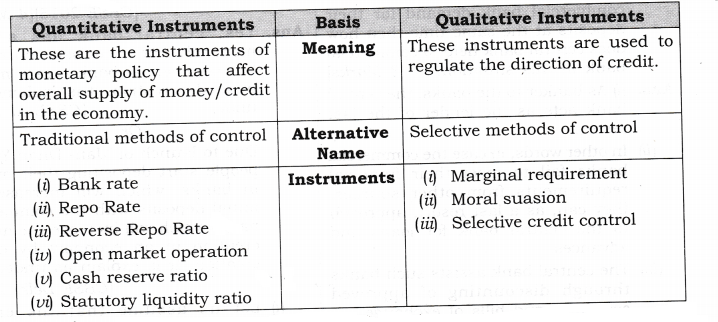
2. Calculate the value of money multiplier and total deposit created if initial deposit is of Rs 1,000 crore and LRR is 20%. [3 Marks]
Ans: 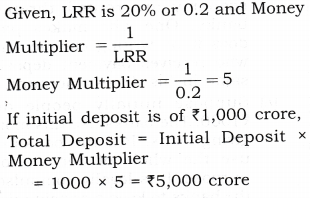
3.If the total deposits created by commercial banks is Rs 10,000 crore and legal reserve requirements is 10%, calculate the amount of initial deposits. [3 Marks]
Ans: 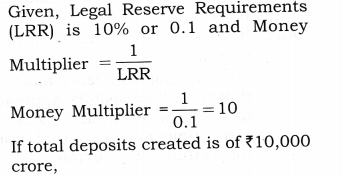
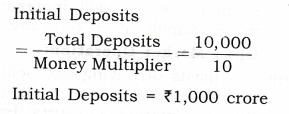
VII. VALUE BASED QUESTIONS
1. In the situation of inflation credit creation by commercial bank is beneficial for the bank but it explain its negative impact on economy.[1 Mark]
Ans: Money creation by commercial bank in the condition of rising prices increases money supply. It creates the situation of excess demand and consequently again increases the price level.
Value: Analytic.
2. Suppose all the customers of a commercial bank demand for their deposits at the same time then how does central bank help to commercial bank in this situation. [3 Marks]
Ans:
- As banker to the banks, the central bank acts as the lender of the last resort.
- In other words, in case the commercial banks fail to meet their financial requirements from other sources, they can, as a last resort, approach to the central bank for loans and advances.
- The central bank assists such banks through discounting of approved securities and bills of exchange. Value: Analytic.
VIII. APPLICATION BASED QUESTIONS
1. Why are the banks required to keep only a fraction of deposits as cash reserves? [3 Marks]
Ans: It is because of the following two reasons:
- The banking experience has revealed that not all depositors approach the banks for withdrawal of money at the same time and also that normally they withdraw a fraction of deposits.
- There is a constant flow of new 150 deposits into the banks. Therefore to meet the daily demand for withdrawal of cash, it is sufficient for banks to keep only a fraction of deposits as a cash reserve.
2. Currency is issued by the central bank, yet we say that commercial banks create money. Explain. How is this money creation by commercial banks likely to affect the national income? Explain.
[CBSE AI 2015][4 Marks] Or
Government of India recently launched ‘Jan-Dhan Yojna’ aimed at every household in the country to have at least one bank account. Explain how deposits made under the plan are going to affect national income of the country.
[CBSE 2015][4 Marks]
Ans: Yes, central bank has a sole monopoly power to issue currency, but commercial bank create money by credit creation. It is explained as under: [CBSE AI 2015]
Or
Due to launch of “Jan- Dhan Yojna” people start depositing their money in banks, which will increase the initial deposits with the commercial bank, which will increase the money creation in an economy by credit creation. It is explain as under:[CBSE Delhi 2015]
- Let us assume that the entire commercial banking system is one unit. Let us call this one unit simply “banks’. Let us also assume that all receipts and payments in the economy are routed through the banks. One who makes payment does it by writing cheque. The one who receives payment deposits the same in his deposit account.
- Suppose initially people deposit ?1000. The banks use this money for giving loans. But the banks cannot use the whole of deposit for this purpose. It is legally compulsory for the banks to keep a certain minimum fraction of these deposits as cash. The fraction is called the Legal Reserve Ratio (LRR). The LRR is fixed by the Central Bank.
- Let us now explain the process, suppose the initial deposits in banks is ?1000 and the LRR is 10 percent. Further, suppose that banks keep only the minimum required, i.e., ^100 as cash reserve, banks are now free to lend the remainder ?900. Suppose they lend ?900. What banks do to open deposit accounts in the names of the borrowers who are free to withdraw the amount whenever they like. Suppose they withdraw the whole of amount for making payments.
- Now, since all the transactions are routed through the banks, the money spent by the borrowers comes back into the banks into the deposit accounts of those who have received this payment. This increases demand deposit in banks by Rs 900. It is 90 per cent of the initial deposit. These deposits of Rs 900 have resulted on account of loans given by the banks. In this sense the banks are responsible for money creation. With this round increase in total deposits is now Rs 1900 (=1000 + 900).
- When banks receive new deposit of Rs 900, they keep 10 per cent of it as cash reserves and use the remaining ?810 for giving loans. The borrowers use these loans for making payments. The money comes back into the accounts of those who have received the payments. Bank deposits again rise, but by a smaller amount of Rs 810. It is 90 per cent of the last deposit creation. The total deposits now increase to Rs 2710 (= 1000 + 900 + 810). The process goes on till the total deposit creation comes to Rs 10000, ten times the initial deposit as shown in the table below.
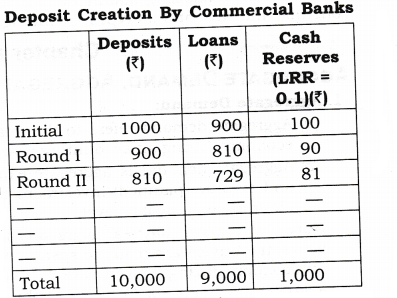
So, with initial deposit of 1000, money creation or money supply increase by 10,000, which will increase the contribution in the flow of goods and services, which will thereby increase the national income. [CBSE (AI) 2015]
Class 12 Macro Economics Aggregate Demand and Its Related Concepts
Very Short Answer Type Questions
Question 1. What is Aggregate demand in Macroeconomics? [CBSE 2005C, 06, 09C, 10; AI 2015]
Answer: It is aggregate expenditure on ex-ante (planned) consumption and ex-ante (planned) investment that all sectors of the economy are willing to incur at each income level.
Question 2. What is Aggregate Supply in Macroeconomics?[CBSE 2015, 1995C, 2000; AI 1999]
Answer: Aggregate supply is the total amount of money value of goods and services, (which is paid to the factor of production against their factor services) that all the producers are willing to supply in an economy.
Question 3. What is consumption function?[CBSE 2008]
Answer: Consumption function expresses functional relationship between aggregate consumption and national income.
Question 4. Can the value of APC be less than zero?
Answer: No, because even at the zero level of income, we will consume something i.e., autonomous consumption.
Question 5. Why can value of MPC be not greater than one? [AI 1998]
Answer: It is so because Keynes’ psychological law of consumption states that when income increases, consumption also increases but at a lesser rate. So, increase in consumption is always less than increase in income, i.e., MPC=ΔC/ΔY is always less than one.
Question 6. Can the value of average propensity to save be negative? If yes,when?[CBSE Foreign 2009]
Answer: Yes, the value of average propensity to save can be negative when consumption is more than national income, i.e., before the break-even point.
Question 7. What can be the maximum value of marginal propensity to save?
Answer: The maximum value of marginal propensity to save is 1. It is only possible when MPC = 0, i.e., the entire additional income is saved.
Question 8. What is the relationship between APC and APS?
Answer: The sum of APC and APS is equal to one, i.e., APC + APS = 1.
Question 9. What is the relationship between marginal propensity to save and marginal propensity to consume?[CBSE Sample Paper 2010]
Answer: The sum total of MPC and MPS is equal to one, i.e., MPC + MPS = 1.
Question 10. Give the meaning of autonomous consumption. [CBSE 2009]
Answer: It refers to minimum level of consumption (i.e., C) , which is needed for survival, i.e., consumption at zero level of national income.
Question 11. Let the consumption be C = 50 + 0.75 Y, then calculate saving function?
Answer: As we know that
S = Y – C = Y -(50 + 0.75 Y)
– Y – 50 – 0.75Y
S = -50 + Y(l-0.75) = -50 + 0.25Y
II. Multiple Choice Questions (1 Mark)
Question 1. If APS is 0.9, how much will be the APC?
(a) 0.2 (b) 0.5
(c) 1 (d) 0.1
Answer: (d)
Question 2. If MPC is 0.6, what will be the MPS?
(a) 0.2 (b) 0.4
(c) 0.9 (d) 0.5
Answer: (b)
Question 3. If disposable income is ?1000 and consumption expenditure is ?750, the value of average propensity to
save will be——————-.
(a) 0.25 (b) 0.9
(c) 0.85 (d) 0.2
Answer: (a)
Question 4. If the saving function is S = -50 + 0.2Y, then the MPC is
(a) 0.45 (b) 0.8
(c) 0.65 (d) 0.25
Answer: (b)
Question 5. There is parametric shift in the consumption line when —————.
(a) slope changes
(b) intercept changes
(c) APC changes
(d) none of them
Answer: (a)Question 2. If MPC is 0.6, what will be the MPS?
(a) 0.2 (b) 0.4
(c) 0.9 (d) 0.5
Answer: (b)
Question 3. If disposable income is ?1000 and consumption expenditure is ?750, the value of average propensity to
save will be——————-.
(a) 0.25 (b) 0.9
(c) 0.85 (d) 0.2
Answer: (a)
Question 4. If the saving function is S = -50 + 0.2Y, then the MPC is
(a) 0.45 (b) 0.8
(c) 0.65 (d) 0.25
Answer: (b)
Question 5. There is parametric shift in the consumption line when —————.
(a) slope changes
(b) intercept changes
(c) APC changes
(d) none of them
Answer: (a)
Long Answer Type Questions (6 Marks)
Question 1. Draw a straight line consumption curve. From it derive the saving curve. Explain the process of derivation on the diagram, show:
(i) The income level at which APC =1.
(ii) The income level at which APS is negative. [CBSE Sample Paper 2014] Or
Outline the steps taken in deriving saving curve from the consumption curve. Use diagram. [CBSE 2012] Or
Draw on a diagram a straight line Consumption curve for an economy. From it derive the saving curve, explaining the method of derivation. Show a point on the consumption curve at which APS = 0?
Answer: To explain the below figure we define the following two terms.
(i) Consumption function: Consumption function expresses functional relationship between aggregate consumption and national income. It can be expressed as:
where =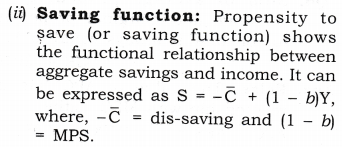
(iii) Figure B is derived from figure A. In Figure A at point
(iv) Corresponding to point P, we derive the point
(v) Before point P in figure A consumption is greater than income, i.e., negative saving or dis-saving, which has been shown in figure B before point 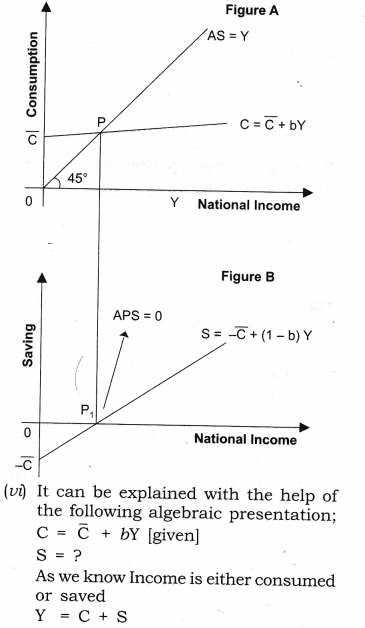

Question 2. Draw on a diagram a straight line savings curve for an economy. From it derive the consumption curve, explaining the method of derivation. Show a point on the consumption curve at which APC =1? [CBSE 2006]
Answer: To explain the above figure we define the following two terms.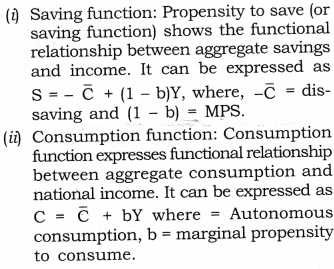
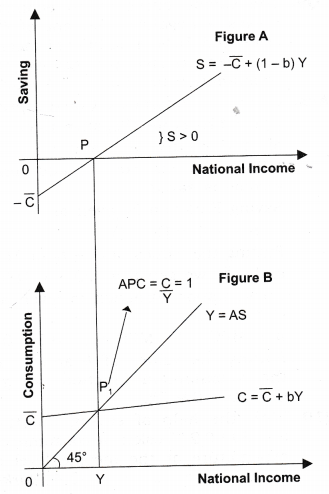
(iii) Figure B is derived from A. In Figure A at point P saving = 0. Corresponding to point P, we derive the point P: in figure B where income = consumption. Point Pj is known as to be break-even point and at this point only APC = 1.
(iv) After point P in figure A savings are positive, which has been shown in figure B, after point Pt where Income is greater than consumption, i.e., positive saving.
(v) Before point P in figure A savings are negative which has shown in figure B before point Pi; where consumption is greater than income, i.e., negative saving or dis-saving.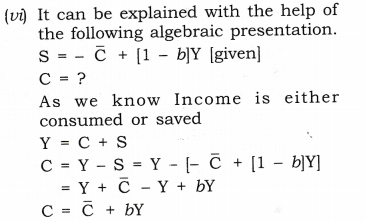
VI. Higher Order Thinking Skills
Question 1. Why APC falls with the increase in income? [ 1 Mark]
Ans: APC falls continuously with the increase in income because the proportion of income spent on consumption keeps on decreasing.
Question 2. Can APC be zero? [1 Mark]
Answer: APC can be zero only when consumption becomes zero. However, consumption is never zero at any level of income. Even at zero level of national income, there is autonomous consumption (C ).
Question 3. What can be the maximum value of marginal propensity to save? [ 1 Mark]
Answer: The maximum value of marginal propensity to save is 1. It is possible only when MPC = 0, i.e., the entire additional income is saved.
Question 4. MPC of the poor is more than that of the rich. [1 Mark]
Answer: True. It happens because the poor spend a greater percentage of their increased income on consumption as most of their basic needs remain unsatisfied. As against it, the rich people spend a smaller proportion as their basic needs are already satisfied.
Question 5. In Keynes theory, MPC fall with an increase in income. [1 Mark]
Ans: False. Because Keynes assumed MPC remains constant. So, with the increase in income, MPC remains constant.
Question 6. What is a guideline? [3 Marks]
Answer: The aggregate supply (AS) curve which is a 45° positively sloping line from the origin. -It is also called a guideline. Every point on AS curve is equidistant from the horizontal axis and the vertical axis implying that total income is equal to total expenditure or spending, i.e., C + S. If whole of national income is spent on consumption of goods and services, S = 0. It is called break-even point.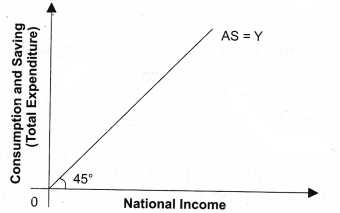
Question 7. Complete the following table:[3-4 Marks]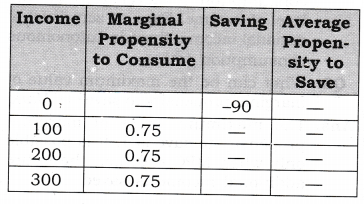
Answer: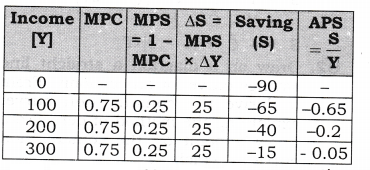
VII. Value Based Question
Question 1. Why do the consumption expenditure of involuntary unemployed worker is not zero, even at zero level of income?[1 Mark]
Answer: A worker has to incur some expenditure to fulfill his basic needs even at zero level of income.
Value: Analytic.
VIII. Applications Based Questions
Question 1. Given below is the consumption function of an economy:C = 100 + 0.5Y.
With the help of a numerical example show that in this economy as income increases APC will decrease.[CBSE Sample Paper 2010][6 Marks]
Answer:
Given consumption function: C = 100 + 0.5Y.
To show that APC decreases with the increase in income, consider the following hypothetical schedule: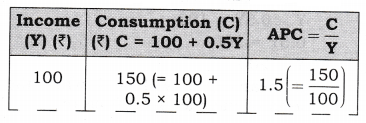
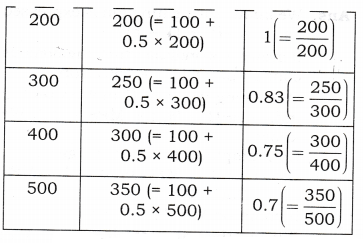
As seen in the given schedule when the income increases from Rs 100 crore to Rs 200 crore and then to Rs 300 crore and so on, APC decreases from 1.5 to 1 and then to 0.83 and keeps on decreasing with the increase in income. Therefore, with an increase in income, APC decreases.
Question 2. What do you understand by ‘parametric shift of a line? How does a line shift when its (i) slope decreases and (ii) its intercept decreases? [3-4 Marks]
Answer: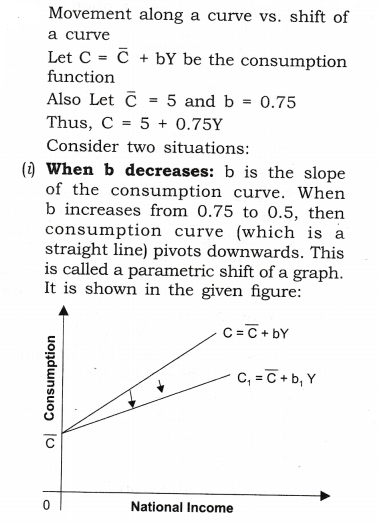
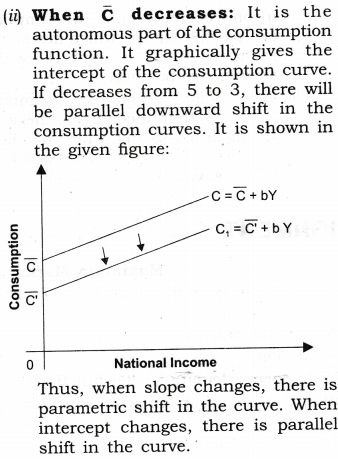
Question 3. “Economists are generally concerned about the rising Marginal Propensity to Save (MPS) in an economy”. Explain why?[CBSE Sample Paper 2016] [3-4 Marks]
Answer:
- As we know, the sum of MPC and MPS is unity. Any Increase in Marginal Propensity to save (MPS) would leads to decrease in Marginal Propensity to consume (MPC).
- It means, with the increase in Income, lesser and lesser proportion of Income is spend on consumption.
- As, consumption is an important component of Aggregate Demand. If consumption falls, Aggregate Demand/Expenditure Fall, which will further leads to fall in Equilibrium level of Income in the economy.
Question 4. Derive a straight line saving curve using the following consumption function:
C = 200 + 0.6 Y. Presuming the income levels to be Rs 100, Rs 200 and Rs 300 crores. Also calculate that level of income where consumption is equal to income.[CBSE Sample Paper 2016] [6 Marks]
Answer: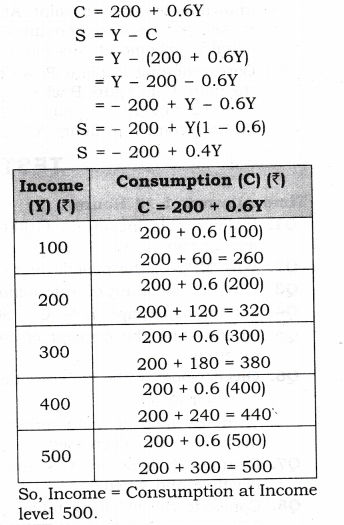
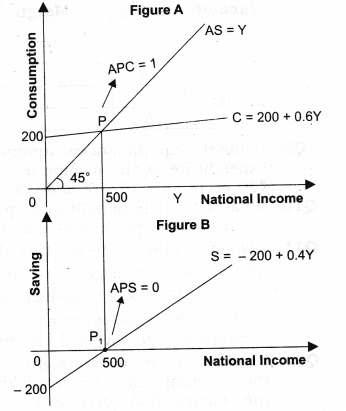
- Figure B is derived from figure A. In Figure A at point P, consumption is equal to national income, which is known as break-even point. At point P, APC = 1 because consumption is equal to income at this point.
- Corresponding to point P, we derive the point Pj in figure B where Saving is equal to zero. At point P: APS = 0. After point P in figure A, national income is greater than consumption, i.e., positive saving, which has shown in figure B, after point P1( where savings are positive.
- Before point P in figure A consumption is greater than income, i.e., negative saving or dis-saving, which has been shown in figure B before point Pi; where savings are negative.
Class 12 Macro Economics National Income Determination and Multiplier
Very Short Answer Type Questions (1 Mark)
Question 1. If planned savings are greater than planned investments, what will be its effect on inventories? [CBSB Sample Paper 2008]
Answer: The inventories will rise.
Question 2. What is meant by effective demand?
Answer: The level at which the economy is in equilibrium, i.e., where aggregate demand = aggregate supply, is called effective demand.
Question 3. Define the term ‘multiplier’. How do we measure it?
Answer: The ratio of change in national income (
(K)=
Question 4. An increase of Rs 1000 crore in invest¬ment leads to a rise of Rs 5000 crore in the national income. Calculate the value of multiplier.
Answer: Multiplier (k)=
=
Question 5. If investment multiplier is 1, what will be the value of marginal propensity to consume?
Answer: Marginal propensity to consume = 0.
Question 6. If marginal propensity to save is 0.1, calculate the value of multiplier.[CBSE 2003]
Answer: Multiplier (k) =
Question 7. If the value of marginal propensity to consume is 0.6, calculate the value of multiplier.
Answer: Multiplier K
=
Multiple Choice Questions (1 Mark)
Question 1. If in an economy investment is greater than saving, national income of the economy,
(a) increases
(b) decreases
(c) remains constant
(d) None of them
Answer: (a)
Question 2. What happens to the level of national income, when aggregate supply falls short of aggregate demand?
(a) Increases (b) Decreases
(c) Constant (d) None of them
Answer: (a)
Question 3. What happens to the level of national income, when aggregate supply exceeds aggregate demand?
(a) Increases
(b) Decreases
(c) Remains constant
(d) None of them
Answer: (b)
Question 4. If MPC and MPS are equal, value of multiplier is,
(a) 2 (b) 1
(c) 5 (d) 3
Answer: (a)
Question 5. What is the relationship between MPS and Multiplier?
(a) Positive (b) Negative
(c) Constant (d) None of them
Answer: (b)
Question 6. What can be the minimum value of investment multiplier?
(a) 0 (b) 1
(c) 2 (d) 5
Answer: (b)
Question 7. What can be the maximum value of investment multiplier?
(a) 5 (b)
(c) 4 (d) 2
Answer: (b)
Short Answer Type Questions (3-4 Marks)
Question 1. What happens to the level of national income when aggregate demand falls short of aggregate supply?
Answer:
- As we know that equilibrium level of national income is determined under the given condition of aggregate demand and aggregate supply, and has tendency to stick to that level i.e., where aggregate demand is equal to aggregate supply.
- As is given in the examination problem that when aggregate demand falls short of aggregate supply, then national income will decrease as shown in the above mentioned diagram.
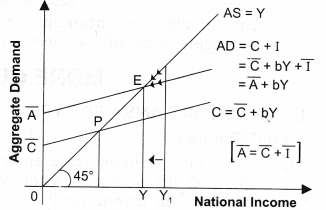
- When AD < AS [At
Y1 ], then there would be stockpiling and producers will produce less. National income will fall and as we know positive relationship exists between national income and consumption, so consumption will fall, which will thereby decrease the aggregate demand till we reach the equilibrium.
Question 2. What happens to the level of national income when aggregate supply falls short of aggregate demand?
Answer:
- As we know that equilibrium level of national income is determined under the given condition of aggregate demand and aggregate supply, and has tendency to stick to that level i.e., where aggregate demand is equal to aggregate supply.
- As is given in the examination problem that when aggregate supply falls short of aggregate demand, then national income will increase as shown in the given diagram:
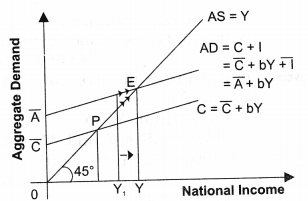
- When AD > AS [At
Y1 ], then production will have to be increased to meet the excess demand. Consequently, national income will increase. As we know that positive relationship exists between national income and consumption. So consumption will increase, which will thereby increase the aggregate demand till we reach the equilibrium.
Question 3. In an economy planned saving is greater than planned investment. Explain how the economy achieves equilibrium level of national income.[CBSE Sample Paper 2014, AI 04, CBSE 04, 05, 09]
Answer:
- It refers to the point that has come to be established under the given condition of aggregate demand and aggregate supply, and has tendency to stick to that level under this given condition. Therefore, AD = AS C + I = C + S I = C + S- C = S
- As given in the examination problem, when planned saving is greater than planned investment, then national income will decrease as shown in the diagram.
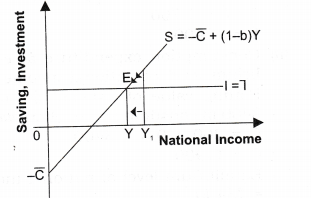
- When saving > investment [at
Y1 ], then there would be stockpiling and producers will produce less. National income will fall and as we know positive relationship exists between national income and saving, then saving will start falling until it becomes equal to investment. It is here the equilibrium level of income is derived.
Question 4. If planned saving is less than planned investment, what changes will bring economy in equilibrium?
Answer:
- It refers to the point that has come to be established under the given condition of aggregate demand and aggregate supply, and has tendency to stick to that level under this given condition. Therefore,
AD = AS C + I = C + S I=C+S-C=S - As given in the examination problem, when planned saving is less than planned investment, then national income will decrease as shown in the below diagram.
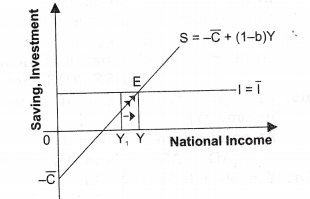
- When, investment > saving [at
Y1 ], then production will have to be increased to meet the excess demand. Consequently, national income will increase leading to rise in saving until saving becomes equal to investment. It is here that equilibrium level of income is established because what the savers intend to save becomes equal to what the investors intend to invest.
Question 5. Discuss relationship between MPC and multiplier. [AI 2006]
Answer:
- If we put maximum value of MPC, i.e., 1, we get maximum value of multiplier, i.e.,
∞ . - As against it, if we put minimum value of MPC, i.e., 0, we get the minimum value of multiplier, i.e. 1.
- So, positive relationship exists between MPC and multiplier. It means when MPC increases, the multiplier also increases and vice-versa.
MPC↑→K↑
Question 6. Discuss relationship between MPS and multiplier. [CBSB 1994C, AI 1997]
Answer:
- If we put minimum of MPS i.e. 0, we get maximum value of multiplier, i.e.,
∞ . - As against it if we get maximum value of MPS, i.e., 1, if we get minimum value of multiplier, i.e.,1.
- Hence, inverse relationship exists between MPS and multiplier.
It means if MPS increases, the multiplier decreases and vice-versa.MPS↑→K↓
Question 7. c = 50 + 0.5Y is the consumption function; where C is consumption expenditure and Y is national income and investment expenditure is 72000 in an economy. Calculate:
(i) Equilibrium level of national income.
(ii) Consumption expenditure at equilibrium level of national income.[CBSE 2013 (Set III)]
Answer:
- Equilibrium level of national income (Y)
At equilibrium, Y = C + I
[AD = AS = Y and AD = C + I]
Or, Y = 50 + 0.5Y + 2,000
[C = 50 + 0.5Y]
0.5Y = 2,050
Y = Rs 4,100 - Consumption expenditure at equilibrium level of national income.
Putting value of national income of 4,100 in consumption function, we get: C = 50 + 0.5 x 4,100 C = Rs 2,100
(a) Equilibrium level of national income = 74,100.
(b) Consumption expenditure at equilibrium level of national income = Rs 1740
Question 8. In an economy, C = 200 + 0.75 Y is the consumption function, where C is consumption expenditure and Y is national income and investment expenditure is Rs 4000 in an economy.Calculate Equilibrium level of national income and consumption expenditure.[AI 2013 (Set II)]
Answer:
- Equilibrium level of national income (Y)
At equilibrium, Y = C + I
[AD = AS = Y and AD = C + I] Or, Y = 200 + 0.75 Y + 4,000
[C = 200 + 0.75 Y]
0.25 Y = 1,200
Y = Rs 16,800 - Consumption expenditure at equilibrium level of national income.
Putting value of national income of 16,800 in consumption function, we get;
C = 200 + 0.75 x 16,800
C = Rs 12,800
(a) Equilibrium level of national income = Rs 16,800;
(b) Consumption expenditure at equilibrium level of national income = Rs 12,800
Question 9. From the following data about an economy, calculate (a) equilibrium level of national income and (b) total consumption expenditure at equilibrium level of national income.
(i) C = 200 + 0.5 Y is the consumption function, where C is consumption expenditure and Y is national income.
(ii) Investment expenditure is 1500.[AI 2013 (Set III)]
Answer:
- Equilibrium level of national income (Y)
At equilibrium, Y = C + I
[AD = AS = Y and AD = C + I]
Or, Y = 200 + 0.5 Y + 1500
[C = 200 + 0.5 Y]
0.5 Y = 1,700
Y = Rs 3400 - Consumption expenditure at equilibrium level of national income. Putting value of national income of 3400 in consumption function, we get; C = 200 + 0.5 x 3400 C = Rs 1900
(a) Equilibrium level of national income = Rs 3400.
(b) Consumption expenditure at equilibrium level of national income = Rs 1900
Question 10. Calculate equilibrium national income from the following data:
[AI 2013, C (Set I)] (i) Consumption expenditure at zero income = Rs 60
(ii) Marginal propensity to consume = 0.9 (iii) Investment = Rs 100
Answer: Equilibrium level of national income (Y) At Equilibrium, Y = C + I
[AD = AS = Y and AD = C + I]
Y =
Or, Y = 60 + 0.9 Y + 100
[C = 60 + 0.9 Y]
0.1 Y = 160
Y = Rs 1600
Question 11. Given consumption function C = 100 + 0.75 Y (where C = -consumption expenditure and Y = national income) and investment expenditure Rs 1,000, calculate: (i) Equilibrium level of national income; (ii) Consumption expenditure at equilibrium level of national income. [CBSE 2009]
Answer:
- Equilibrium level of national income (Y)
At equilibrium, Y = C + I
[AD = AS = Y and AD = C + I] Or, Y = 100 + 0.75 Y + 1,000
[C = 100 + 0.75 Y]
0.25 Y = 1,100
Y = Rs 4,400 - Consumption expenditure at equilibrium level of national income. Putting value of national income of 4,400 in consumption function, we get; C = 100 + 0.75 x 4,400 C = Rs 3,400
(a) Equilibrium level of national income = Rs 4,400;
(b) Consumption expenditure at equilibrium level of national income = Rs 3,400
Question 12. In an economy the consumption function is C = 500 + 0.75 Y, where C is consumption expenditure and Y is income. Calculate the equilibrium level of income and consumption expenditure when investment expenditure is Rs 5,000.[CBSE Foreign 2010 (I)]
Answer:
- Equilibrium level of national income (Y)
At equilibrium, Y = C + I
[AD = AS = Y and AD = C + I] Or, Y = 500 + 0.75 Y + 5,000
[C = 500 + 0.75 Y]
0.25 Y = 5,500
Y = Rs 22,000 - Consumption expenditure at equilibrium level of national income. Putting value of National Income of 22,000 in consumption function, we get;
C = 500 + 0.75 x 22,000 C = Rs 17,000
Equilibrium level of income = Rs 22,000; Consumption expenditure at equilibrium level of income = Rs 17,000.
Question 13. Suppose that consumption equals C = 100 + 0.75 Y, and investment equals I = Rs 50 and Y = C + I. Find;
(i) The equilibrium level of income
(ii) The level of consumption at equilibrium, and
(iii) The level of saving at equilibrium.
Answer:
- Y = C + I
Y = 100 + 0.75 Y + 50
Y – 0.75 Y = 150
0.25 - C = 100 + 0.75 600 = Rs 550
- S = Y – C = 600 – 550 = Rs 50
Question 14. Find national income from the following data: [CBSE 2012]Autonomous consumption = Rs 100 Marginal propensity to consume = 0.80 Investment = Rs 50
Answer: As given in the examination problem, Autonomous consumption or C =150 Autonomous investment or I = Rs 50 MPC or b = 0.80 So, AD = C + I = C + bY + I = 100 + 0.8 Y + 50 = 150 + 0.8 Y
As we know that the equilibrium level of national income in two sector model is determined where,
AS = AD
Y = 150 + 0.8Y
Y – 0.8Y = 150 Y(1—0.8) = 150
Y=
Question 15. An economy is in equilibrium. Find Marginal Propensity to Consume from the following: [CBSE 2015] National Income = 2000 Autonomous Consumption = 400 Investment Expenditure = 200
Answer: Autonomous consumption or C = Rs 400 Equilibrium level of income or Y = Rs 2000 MPC or b = ?
At equilibrium, Y = C + I
[AD = AS = Y and AD = C + I] Y = C + bY + I
2000 = 400 + b(2000) + 200 2000 – 600 = b(2000)
1400 = b(2000)
MPC(b) = 0.7
Question 16. An economy is in equilibrium. Calculate the Investment Expenditure from the following: [AI 2015] National Income = 800
Marginal Propensity to Save = 0.3 Autonomous Consumption =100
Answer: Autonomous consumption or C = Rs 100 Equilibrium level of income or Y = Rs 800 MPS = 0.3
MPC or b = 1 – MPS = 0.7 At equilibrium, Y = C + I
[AD = AS = Y and AD = C + I]
Y = 100 + 0.7Y + I
800 = 100 + 0.7(800) + I
800 = 100 + 560 + 1
I = 140
Question 17. As a result of increase in investment by Rs 125 crore national income increases by Rs 500 crore. Calculate marginal propensity to consume.[CBSE 2008]
Answer: Multiplier k =
We also know that Multiplier (k)
or or 4 — 4 MPC = 1 or MPC = 3/4 = 0.75
Question 18. As a result of increase in investment national income increases by Rs 600 crore. If marginal propensity to consume is 0.75, calculate the increase in investment. [CBSE 2008]
Answer: Multiplier (k)
We also know that k
=
Hence, change in investment
=Rs 150 crore
Increase in investment = Rs 150 crore
Class 12 Macro Economics Government Budget and the Economy
Question 1. Explain why public goods must be provided by the government? [3-4 Marks]
Answer:
- Public goods are those goods and services for which consumption by some individuals does not reduce the amount available to others.
- For example parks,roads,water,bridges,national defense etc..
- these goods are non-rival and non-excludable ones.
- people receives benefits from public goods but do not pay for them.Such a goods can only prepared by government.
Question 2. Distinguish between revenvu expenditure and capital expenditure .
State the basis of classifying government expenditure into revenue and capital expenditure. Give an example of each.
Answer: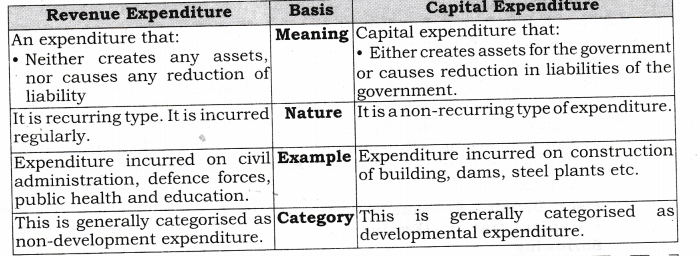
Question 3. The fiscal deficit gives the borrowing requirement of the government Elucidate. [3-4 Marks]
Answer:
- Fiscal deficit is defined as excess of total expenditure over total receipts (revenue and capital receipts) excluding borrowing. In the form of an equation:
Fiscal Deficit = Total Budget Expenditure – Total Budget Receipts (Net of borrowing)
= Total Expenditure (Revenue
Expenditure + Capital Expenditure) – Revenue Receipts (Tax Revenue + Non-Tax Revenue) – Non-Debt Capital Receipts (Recovery of Loans + Dis-investment Proceeds)
= Revenue Deficit + Capital Deficit (excluding Borrowing)- Borrowing
= Net borrowing at home + Borrowing from RBI + Borrowing from abroad - Fiscal deficit shows total borrowing requirements of the government from all sources.
- As the government borrowing increases, its liability in future to repay loan with interest also increases leading to a higher revenue deficit. Therefore, fiscal deficit should be as low as possible.
Question 4. Give the relationship between revenue deficit and fiscal deficit. [3-4 Marks]
Answer:
- Fiscal deficit is always a wider concept than revenue deficit.
- Revenue deficit is defined as the excess of government’s revenue expenditure over revenue receipts. In terms of formula:
Revenue Deficit = Revenue Expenditures (RE) – Revenue Receipts (RR) - In short, there will be revenue deficit in a government budget when revenue expenditure exceeds revenue receipts.
- Fiscal deficit is defined as the excess for all expenditure over total receipts net of borrowings.
- Initially, Fiscal deficit does not take into account all types of receipts. It does not take into account borrowings. But finally they have to depend on borrowing to met fiscal deficit.
Fiscal Deficit = Revenue Deficit + Capital Deficit (Excluding Borrowing)- Borrowing
= Net borrowing at home + Borrowing from RBI + Borrowing from abroad
Question 5. Does public (government) debt impose a burden? Explain. [3-4 Marks]
Answer: Public debt is not always a blessing. Excessive use of it creates a lot of crisis in an economy; such as,
- Hampers Economic Development of a Country: Loans are easily borrowed but it is very difficult to repay them.Generally, government imposes more taxes. It brings instability and is an obstacle in the economic development of a country.
- Poses Threat to Political Freedom: Foreign loans and assistance lead to deep conflict among countries. The friction among countries challenges the political freedom.
- Proves a Burden on Common Man: Loans taken for unproductive purposes, like war and armaments, are a burden on common man in the form of higher taxes.
- Leads to Extravagant Spending: Public debt leads to unplanned spending. This provides incentive to the government to implement the schemes that require excessive expenditure.
- Results in Drain of National Wealth: Repayment of foreign loans results in drain of wealth out of the country.
Question 6. Are fiscal deficits necessarily inflationary? [3-4 Marks]
Or
“Governments across nations are too much worried about the term fiscal deficit”. Do you think that fiscal deficit is necessarily inflationary in nature? Support your answer with valid reasons.
Answer:
- Fiscal deficits are not necessarily inflationary.
- As we know fiscal deficit shows borrowing requirement of the government.
- If we borrow when there is a situation of underemployment in an economy i.e., in a situation of deficient demand, then it is not inflationary because in a situation of deficient demand output is held back because of lack of demand.
- A high fiscal deficit (borrowing) is accompanied by higher demand and greater output which is not inflationary.
- On the other hand, if we borrow at the full employment level, then it is inflationary in nature.
- A high fiscal deficit (borrowing) is accompanied by higher prices because aggregate demand is greater than aggregate supply at the full employment level which is always inflationary.
Question 7. Discuss the issue of deficit reduction.[3-4 Marks]
Answer: The deficit in a government budget can be reduced by the following steps:
- Taxes should be increased. Government can make a plan for rising direct taxes to increase its receipts can also be raised by increasing rates of taxes or by imposing new taxes.
- Reduction in Government Expenditures: It can be done through making government activities more efficient through better planning of programmes and better administration.
- The government can raise Receipts through the sale of shares in PSUs (Public Sector Undertaking).
- Changing the scope and role of government by withdrawing from same areas where it operated before.
MORE QUESTIONS SOLVED
I. Very Short Answer Type Questions (1 Mark)
Question 1. Define government budget.
Answer: A government budget is an annual financial statement showing item wise estimates of expected revenue and anticipated expenditure during a fiscal year.
Question 2. State any one obj ective of a government budget.
Answer: Activities to secure a reallocation of resources
Question 3. Define a tax.
Answer: A tax is a legally compulsory payment imposed by the government on income and profit of persons and companies without reference to any benefit. Tax is of two types: Direct tax and Indirect tax.
Question 4. Why is service tax an indirect tax?
Answer: Its impact and incidence lie on different persons.
Question 5. State any two sources of non-tax revenue receipts.
Answer:
- Commercial revenue (profit and interest)
- Administrative revenueffees, fines and penalties, escheats etc)
Question 6. Is borrowing by the government a revenue receipt?
Answer: No, it is not so because it creates a liability (for the government) of repayment.
Question 7. Why is tax not a capital receipt?
Answer: Tax is not a capital receipt because it leads neither to creation of liability nor to reduction in assets.
Question 8. Why is interest termed as a revenue receipt?
Answer: Interest is a revenue receipt because it creates neither any liability nor causes a reduction in the assets of the government.
Question 9. Why are borrowings a capital receipt?
Answer: They create a liability (in terms of repayment).
Question 10. Why are subsidies treated as revenue expenditure?
Answer: Subsidies are treated as revenue expenditure because they create neither any asset nor cause a reduction in any liability of the government.
Question 11. Why is repayment of loan a capital expenditure?
Answer: It reduces the liabilities of the government.
Question 12. Why is recovery of loans treated as a capital receipt?[CBSE All India 2005]
Answer: Recovery of loans is treated as a capital receipt because it reduces assets of the government.
Question 13. Why are receipts from taxes categorised as revenue receipts?
Answer: Receipts from taxes are categorised as revenue receipts because they create neither any liability nor cause a reduction in the assets of the government.
Question 14. What is meant by revenue deficit?
Answer: Revenue deficit refers to the excess of revenue expenditure of the government over its revenue receipts. Revenue Deficit = Revenue Expenditure- Revenue Receipts
Question 15. If the revenue receipts are Rs. 1,000 crore and revenue expenditure is Rs. 1,200 crore, how much will be the revenue deficit?
Answer: Revenue Deficit = Revenue Expenditure – Revenue Receipts = 1,200 – 1,000 = Rs. 200 crore.
Question 16. Define fiscal deficit.
Answer: Fiscal deficit is defined as excess of total expenditure over total receipts (revenue and capital receipts) excluding borrowing.
Question 17. What is the meaning of primary deficit?
Answer: Primary deficit refers to the difference between fiscal deficit of the current year and interest payments on the previous borrowings.
Question 18. How is primary deficit calculated?
Answer: Primary Deficit = Fiscal Deficit – Interest Payments
Question 19. What does zero primary deficit mean?
Answer: If primary deficit is zero, fiscal deficit= interest payments. It means the government has to borrow only for its interest commitments on earlier loans.
II. Multiple Choice Questions (1 Mark)
Question 1. Budget is placed before:
(a) Lok Sabha
(b) Rajya Sabha
(c) Both Lok Sabha and Rajya Sabha
(d) Parliament
Answer: (c)
Question 2. Budget is a:
(a) Financial statement
(b) Monetary statement
(c) Political statement
(d) All of them
Answer: (a)
Question 3. Which article of the Constitution takes about the budget?
(a) Article 110 (b) Article 111
(c) Article 112 (d) Article 113
Answer: (c)
Question 4. One year period from 1 April to 31 March of next year is called a:
(a) Monetary year (b) Fiscal year
(c) Plan year (d) Tax year
Answer: (b)
Question 5. Capital receipts may come from:
(a) Market borrowings
(b) Provident funds
(c) Recoveries of loans
(d) All of them
Answer: (d)
Question 6. Find direct tax among the following taxes:
(a) Personal income tax
(b) Excise duty
(c) Sales tax
(d) Service tax
Answer: (a)
Question 7. Among the following types of taxes, find the indirect one.
(a) Gift tax
(b) Corporate income tax
(c) VAT
(d) Wealth tax
Answer: (c)
Question 8. If budgetary deficit is nil and borrowings and other liabilities are 70 crore, what is the amount of fiscal deficit?
(a) Nil (b) 30 crore
(c) Can’t say (d) 70 crore
Answer: (d)
Question 9. When the government tries to,meet the gap of public expenditure and public revenue through borrowing from the banking system, it is called
(a) deficit financing
(b) debt financing
(c) credit financing
(d) none of them
Answer: (a)
Question 10. ……….is the difference between
total receipts and total expenditure.
(a) Fiscal deficit
(b) Budget deficit
(c) Revenue deficit
(d) Capital deficit
Answer: (b)
Question 11. If borrowings and other liabilities are added to the budget deficit, we get
(a) revenue deficit
(b) capital deficit
(c) primary deficit
(d) fiscal deficit
Answer: (d)
Question 12. Payment of interest is _
(a) revenue expenditure.
(b) capital expenditure
(c) primary deficit.
(d) fiscal deficit
Answer: (a)
Short Answer Type Questions (3-4 Marks)
Question 1. Explain objective of stability of prices of government budget. [CBSE, (F) 2010] Or
Explain the ‘economic stability’ objective of a government budget. [CBSE, AI2011] Or
Explain stabilising activities function of budget.
Answer:
- Free play of market forces (or the forces of supply and demand) are bound to generate trade cycles, also called business cycles.
- These refer to the phases of recession, depression, recovery and boom in the economy.
- The government of a country is always committed to save the economy from business cycles. Budget is used as an important policy instrument to combat(solve) the situations of deflation and inflation.
- By doing it the government tries to achieve the state of economic stability.
- Economic stability leads to more investment and increases the rate of growth and development.
Question 2. Name two sources each of non-tax revenue receipts. [CBSE 2004]
Answer: Non-tax revenue refers to government revenue from all sources other than taxes called non-tax revenue. These are incomes, which the government gets by way of sale of goods and services rendered by different government departments. Its two sources are:
- Commercial Revenue (Profit and interest): It is the revenue received by the government by selling the goods and services produced by the government agencies. For example, profit of public sector undertakings like Railways, BHEL, LIC etc. Government gives loan to State Government, union territories, private enterprises and to general public and earns interest receipts from these loans. It also includes interest and dividends on investments made by the government.
- Administrative Revenue: The revenue that arises on account of the administrative function of the government. This includes:
(i) Fee: Fee refers to a payment made to the government for the services that it renders to the citizens. Such services are generally in public interest and fees are paid by those, who receive such services. For example, passport fees, court fees, school fees in government schools,
(ii) License Fee: License fee is a payment to grant a permission by a government authority. For example, registration fee for an automobile.
Question 3. Distinguish between: Revenue receipts and capital receipts. [CBSE 2005, 10]
Or
Distinguish between ‘revenue receipt’ and ‘capital receipt’ and give two examples of each. [CBSE 2007]
Answer:

Question 4. Distinguish between Direct tax and indirect tax.
Answer: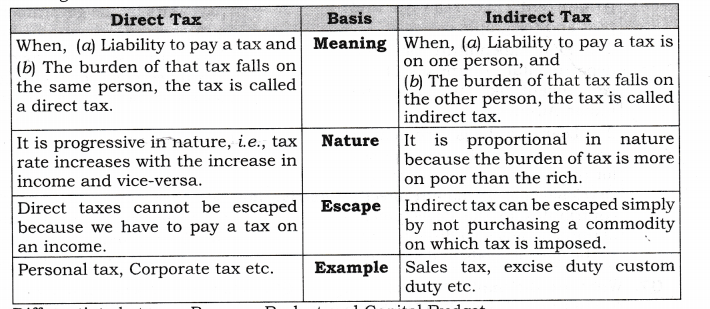
Question 5. Differentiate between Revenue Budget and Capital Budget.
Answer: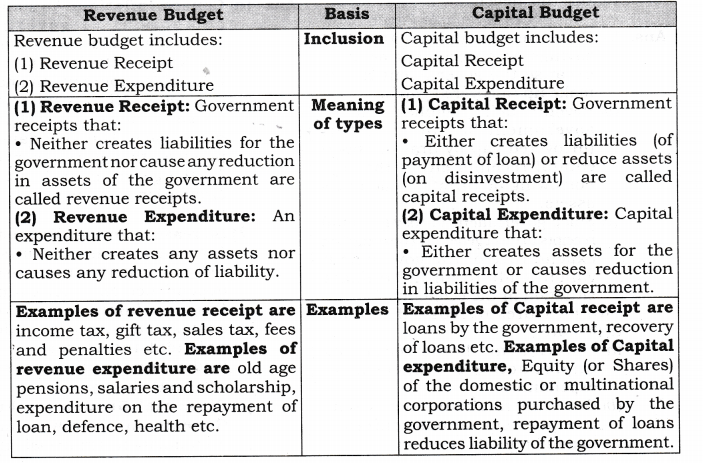
Question 6. Differentiate between Developmental and Non-Developmental Expenditure.
Answer: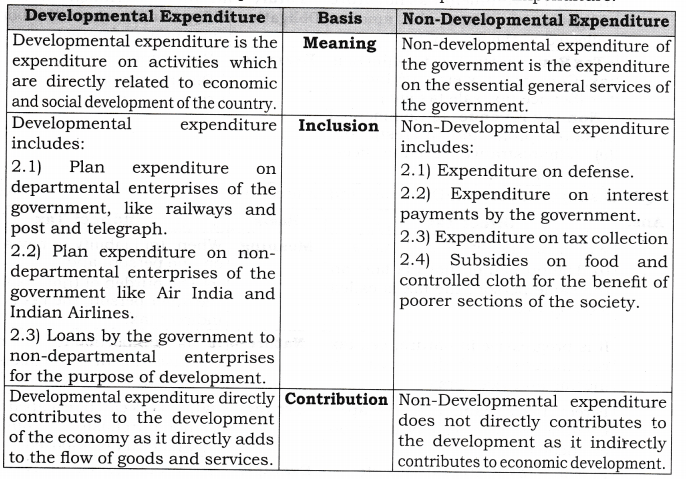
Question 7. What are the implications of a large revenue deficit? Give two measures to reduce this deficit. [CBSE Sample Paper 2010]
Answer:
- Revenue deficit indicates dis¬savings on government account because the government has to make up uncovered gap.
- Revenue deficit implies that the government has to cover’this uncovered gap by drawing upon capital receipts either through borrowing or through sale of its assets.
- Since government is using capital receipts to meet generally consumption expenditure of the government which leads to an inflationary situation in the economy.
Two measures to reduced revenue deficit are :
- Government should reduce its unproductive or unnecessary expenditure.
- Government should increase its receipts from various sources of tax and non-tax revenue.
Question 8. What are implications of fiscal deficit? [A/2005; CBSE 06C, 07]
Answer:
- Causes Inflation: An important component of government borrowing includes borrowing from the Reserve Bank of India. This invariably implies deficit financing or meeting deficit requirements of the government by way of printing more notes. This is a dangerous practice, though very convenient for the government. It increases circulation of money and causes inflation.
- Increase in Foreign Dependence:Government also borrows from rest of the world. It increases our dependence on other countries. Foreign borrowing is often associated with economic and political interference by the lender countries. It increases our economic slavery.
- Financial Burden for Future Generation: Borrowing implies accumulation of financial burdens for the future generations. It is for future generations to repay loans as well as the mounting interest thereon.
- Deficits Multiply Borrowings:Payments of interest increases revenue expenditure of the government, causing an increase in its revenue deficit. Thus, a vicious circle set wherein deficits multiply borrowings.
IV. True Or False
Are the following statements true or false? Give reasons.
Question 1. Government budget is a statement of actual receipts and payments of the government.
Answer: False.
Reason: It is a statement of “Estimated’ (and not actual) receipts and payments of the government.
Question 2. Rise in revenue deficit will always lead to higher fiscal deficit.
Answer: False.
Reason: Fiscal deficit leads to rise in revenue deficit.
Question 3. Service tax is a indirect tax as its impact and incidence is on the same individual.
Answer: False.
Reason: Its burden can be shifted to others.
Question 4. Direct tax are generally ‘Proportional’ in nature.
Answer: False.
Reason: Direct taxes are generally ‘progressive’ in nature.
Question 5. Primary deficit is the difference between capital deficit and interest payments.
Answer: False.
Reason: Primary deficit is the difference between fiscal deficit and interest payments.
Question 6. Non-debt capital receipts only includes disinvestment.
Answer: False.
Reason: It also includes the recovery of loan.
Question 7. Fiscal deficit is non-inflationary.
Answer: False.
Reason: Fiscal deficit can be inflationaiy when we are at full employment level.
It is so because large fiscal deficits creates excess money supply that creates inflation.
Question 8. Expenditure made on the development of a railway line is a capital expenditure.
Answer: True.
Reason: This expenditure creates an asset for the railway and government.
Note: As per CBSE guidelines, no marks will be given if reason to the answer is not explained.
Note: As per CBSE guidelines, no marks will be given if reason to the answer is not explained.
V. Long Answer Type Questions (6 Marks)
Question 1 . Explain the role the government can play through the budget in influencing allocation of resources. [CBSE 2015] OR .
Explain the ‘allocation of resources’ objective of government budget.[CBSE 2011] OR
Explain the allocation function of agovernment budget. [CBSE AI2010]OR
Explain how government can influence allocation of resources through government budget.
Answer:
- Private enterprises always desire to allocate resources to those areas of production where profits are high.
- However, it is possible that such areas of production (like production of alcohol) may not promote social welfare.
- Through its budgetary policy the government of a country directs ‘ the allocation of resources in a manner such that there is a balance between the goals of profit maximisation and social welfare.
- Production of goods which are injurious to health (like cigarettes and whisky) is discouraged through heavy taxation.
- On the other hand, production of “socially useful goods” (like electricity, ‘Khadij is encouraged through subsidies.
- So, finally government has to reallocate resources in accordance to social and economic considerations in case the free market fails to do or does so inefficiently.
Question 2. Explain how the government can use the budgetary policy in reducing inequalities of incomes. [AI 2015] OR
How can a government budget help in reducing inequalities of income? Explain. [CBSE 2009]OR
How can a government budget be helpful in altering distribution of income in an economy? Explain.[CBSE 2010] OR
Explain ‘redistribution of income’ objective of government budget. [CBSE2011, A/2011] OR
Reduction in income inequalities raises welfare of the people. How can government help, through government budget, in this regard? Explain? [A/2013, C (Set /)]
Answer:
- Budget of a government shows its comprehensive exercise on the taxation and subsidies.
- A government uses fiscal instruments of taxation and subsidies with a view of improving the distribution of income and wealth in the economy.
- A government reduces the inequality in the distribution of income and wealth by imposing taxes on the rich and giving subsidies to the poor, or spending more on welfare of the poor.
- It will reduce income of the rich and raises the living standard of the poor, thus, leads to equitable distribution of income.
- Expenditure on special anti poverty and employment schemes will be increased to bring more people above poverty line.
- Public distribution system should be inferred so that only the poor could get foodgrains and other essential items at subsidised prices.
- Equitable distribution of income and wealth is a sign of social justice which is as the principal objective of any welfare state in India.
Categorize the following items into Revenue and Capital Receipts
Question 1. Statement—Loan from the Australian government. [CBSE Delhi 2006]
Answer: Capital receipt.
Reason: It creates liability for the government.
Question 2. Statement—Corporation tax. [CBSE Delhi 2006, Sample Paper 10] OR
Statement—Income tax received by government.
Answer: Revenue receipt.
Reason: It creates neither any liability nor reduces any asset of the government.
Question 3. Statement—Grants received from International Monetary Fund
Answer: Revenue receipt.
Reason: It creates neither any liability nor reduces any asset of the government.
Question 4. Statement—Profits of public sector undertakings. [ CBSE Sample Paper 2010]
Answer: Revenue receipt.
Reason: It creates neither any liability nor reduces any asset of the government.
Question 5. Statement—Sale of a public sector undertaking. [CBSE Delhi 2006]OR
Statement—Receipts from sale of shares of a public sector undertaking. [CBSE Sample Paper 2010]
Answer: Capital receipt.
Reason: It reduces assets of the government.
Question 6. Statement—Foreign aid against earthquake victims.
Answer: Revenue receipt.
Reason: It creates neither any liability nor reduces any asset of the government.
Question 7. Statement—Dividends on investments made by government.[CBSE Delhi 2006]
Answer: Revenue receipt.
Reason: It creates neither any liability nor reduces any asset of the government.
Question 8. Statement—Borrowings from public.
Answer: Capital receipt.
Reason: It creates liability for the government.
Question 9. Statement—Fees of a Government College.
Answer: Revenue receipt.
Reason: It creates neither any liability nor reduces any asset of the government.
Question 10. Statement—Recovery of loans. [CBSE Delhi 2006]
Answer: Capital receipt.
Reason: It reduces assets of the government.
Question 11. Statement—Loans recovered from public sector enterprises.
Answer: Capital receipt.
Reason: It reduces assets of the government.
Question 12. Statement—License and court fees received by the government in the year 2012-13
Answer: Revenue receipt.
Reason: It creates neither any liability nor reduces any asset of the government.
Question 13. Statement—Loan taken from the USA for the infrastructural developments.
Answer: Capital receipt.
Reason: It creates liability for the government.
Question 14. Statement—Sale of shares held by Government in a PSU.
Answer: Capital receipt.
Reason: It reduces assets of the government.
Question 15. Statement—Financial help from microsoft for the victims of flood affected areas.
Answer: Revenue receipt.
Reason: It creates neither any liability nor reduces any asset of the government
Question 16. Statement—Amount borrowed from Japan for construction of Metro.
Answer: Capital receipt.
Reason: It creates liability for the government.
Question 17. Statement—Dividend received by government from a company.
Answer: Revenue receipt.
Reason: It creates neither any liability nor reduces any asset of the
government.
Question 18. Statement—Funds raised from public in the form of National Saving Certificates and Kisan Vikas Patras.
Answer: Capital receipt.
Reason: It creates liability for the government.
Question 19. Statement—Sale of 40% shares of a public sector undertaking to a private enterprise.
Answer: Capital receipt.
Reason: It reduces assets of the L government.
Question 20. Statement—Profits of LIC, a public enterprise.
Answer: Revenue receipt.
Reason: It creates neither any s liability nor reduces any asset of the government.
Categorize the following items intoDirect and Indirect Taxes
Question 1. Statement—Corporation tax. [CBSE Foreign 2006]
Answer: Direct tax.
Reason: Its impact and incidence lie on the same person.
Question 2. Statement—Value Added tax. [ CBSE Delhi 2010]
Answer: Indirect tax.
Reason: Its impact and incidence lie on different persons.
Question 3. Statement—Service tax. [CBSE Foreign 2006]
Answer: Indirect tax.
Reason: Its impact and incidence lie on different persons.
Question 4. Statement—Wealth tax. [CBSE Foreign 2006, Delhi 2010]
Answer: Direct tax.
Reason: Its impact and incidence lie on the same person.
Question 5. Statement—Indirect tax. [CBSE Foreign 2006]
Answer: Indirect tax.
Reason: Its impact and incidence lie on different persons.
Question 6. Statement—Income tax.
Answer: Direct tax.
Reason: Its impact and incidence lie on the same person.
Question 7. Statement—Entertainment tax.
Answer: Indirect tax.
Reason: Its impact and incidence lie on different persons.
Question 8. Statement—Corporate tax.
Answer: Direct tax.
Reason: Its impact and incidence lie on the same person.
Question 9. Statement—Excise duty.
Answer: Indirect tax.
Reason: Its impact and incidence lie on different persons.
Question 10. Statement—Custom duty.
Answer: Indirect tax.
Reason: Its impact and incidence lie on different persons.
Question 11. Statement—Capital Gains Tax.
Answer: Direct tax.
Reason: Its impact and incidence lie on the same person.
Categorize the following items into Revenue and Capital Expenditure
Question 1. Statement—Subsidies. [CBSE AI 2006]
Answer: Revenue expenditure.
Reason: It creates neither any asset nor reduces any liability of the government.
Question 2. Statement—Defence capital equipments purchased from Germany.
Answer: Capital expenditure.
Reason: It increases asset of the government.
Question 3. Statement—Grants given to State Governments. [CBSE AI 2006]
Answer: Revenue expenditure.
Reason: It creates neither any asset nor reduces any liability of the government.
Question 4. Statement—Construction of school building. [CBSE AI 2006]
Answer: Capital expenditure.
Reason: It increases asset of the government.
Question 5. Statement—Expenditure incurred on administrative and defence services.
Answer: Revenue expenditure.
Reason: It creates neither any asset nor reduces any liability of the government.
Question 6. Statement—Repayment of loan. [CBSE AI 2006]
Answer: Capital expenditure.
Reason: It reduces the liability of the government.
Question 7. Statement—Amount spent on construction of Bridges
Answer: Capital expenditure.
Reason: It increases asset of the government.
Question 8. Statement—Payment of salaries to staff of government hospitals.
Answer: Revenue expenditure.
Reason: It creates neither any asset nor reduces any liability of the government.
Question 9. Statement—Purchase of 20 cranes for the construction of flyovers
Answer: Capital expenditure.
Reason: It increases asset of the government.
Question 10. Statement—Amount borrowed from USA repaid.
Answer: Capital expenditure.
Reason: It reduces the liability of the government.
Question 11. Statement—Salary paid to Army officers.
Answer: Revenue expenditure.
Reason: It creates neither any asset nor reduces any liability of the government.
Question 12. Statement—Purchase of Metro coaches from Japan.
Answer: Capital expenditure.
Reason: It increases asset of the government.
Question 13. Statement—Repayment of Loan taken from the World Bank.
Answer: Capital expenditure.
Reason: It reduces the liability of the government.
Question 14. Statement—Grants given by central government to state government.
Answer: Revenue Expenditure.
Reason: It creates neither any asset nor reduces any liability of the government.
Question 15. Statement—Loan given to Union Territories
Answer: Capital expenditure.
Reason: It increases asset of the government.
Question 16. Statement—Interest paid on National Debt.
Answer: Revenue expenditure.
Reason: It creates neither any asset nor reduces any liability of the government.
Question 17. Statement — Expenditure on construction of Metro.
Answer: Capital expenditure.
Reason: It increases asset of the government.
Question 18. Statement—Pension paid to retired government employees.
Answer: Revenue expenditure.
Reason: It creates neither any asset nor reduces any liability of the government.
Question 19. 10% shares purchased by the government in a private company.
Answer: Capital expenditure.
Reason: It increases asset of the government.
VI. Higher Order Thinking Skills
Question 1. Define debt trap. [1 Mark]
Answer: It is a vicious circle set wherein the government takes more loans to repay earlier loans.
Question 2. Distinguish between revenue deficit and fiscal deficit. [CBSE 2009, 13] [3 Marks]
Answer: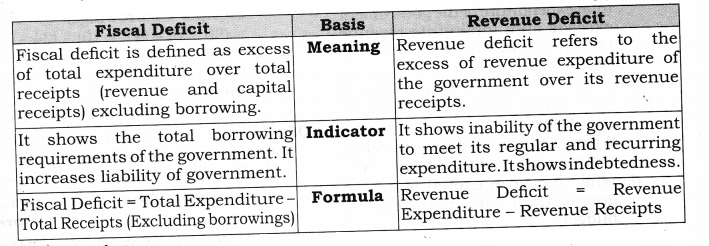
Question 3. Difference between primary deficit and fiscal deficit. [Delhi 2013] [3 Marks]
Answer: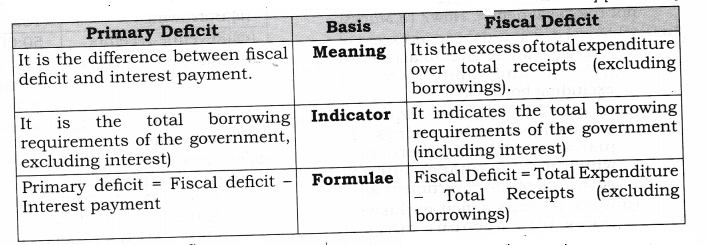
Question 4. How can a deficit be financed? [3 Marks]
Answer: A deficit can be financed in two ways:
- Monetary Expansion: It means printing new notes to the extent of deficit. It involves government borrowings from the Central bank (Reserve Bank of India) through the issue of the treasury bills to the Central Bank. The Central Bank purchases the treasury bills in return for cash (procured by printing new notes). The government use this cash to finance the deficit.
- The second method of financing the deficit is borrowing by the government from the public through market loans etc.
- By borrowing from abroad (rest of the world).
Question 5. Can there be a fiscal deficit in a government budget without a revenue deficit? Explain. [CBSE Sample Paper 2008] [3-4 Marks]
Answer:
- Yes, there can be a fiscal deficit in government budget without any revenue deficit.
- Revenue deficit is a position where total revenue expenditure of the government exceeds its total revenue receipts.
- Fiscal deficit is a position where total expenditure of the government exceeds sum total of its revenue receipts and non-debt capital receipts.
- Hence, there can be a fiscal deficit without revenue deficit in following situations:
(i) When capital budget shows a deficit and revenue budget is balanced.
(ii) When deficit in capital budget is greater than surplus in revenue budget.
Question 6. Revenue deficit is the real deficit and not the fiscal deficit. How? [3 Marks]
Answer:
- Fiscal deficit is defined as excess of total expenditure over total receipts (revenue and capital receipts) excluding borrowing.
- In other words, it is equal to borrowings and borrowings are just an act of the government which may be finance interest payments of the government also.
- While revenue deficit exclusively takes into account current interest payment obligations of the government not connected with the actual activities.
- Thus, revenue deficit is more important than fiscal deficit.
Question 7. From the following data about a government budget find: (a) revenue deficit, (b) fiscal deficit and (c) primary deficit: [CBSE, All India 2011] [3 Marks]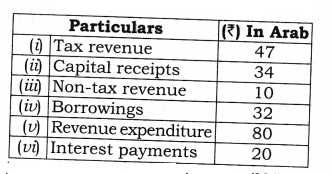
Answer: (a) Revenue deficit = Revenue expenditure – Revenue receipts (Tax revenue + Non-tax Revenue)
= 80 – (47+10) = Rs. 23 Arab
(b) Fiscal deficit = Total expenditure (Revenue expenditure + Capital expenditure) – Revenue receipts(Tax revenue + Non-tax revenue) – Non-debt Capital ReceiptfCapital receipts – borrowings)
= (80 + 0) – (47 + 10) – (34 – 32)
= 80 – 57 – 2 = Rs. 21 Arab
(c) Primary deficit = Fiscal deficit – Interest payments
= 21 – 20 = Rs. 1 Arab
8. Find (a) fiscal deficit and (b) primary deficit from the following items: [CBSE Sample Paper 2013] [3 Marks]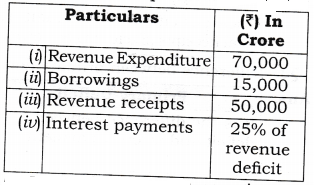
Answer: (a) Fiscal deficit = Borrowings = Rs. 15000 crore.
(b) Primary deficit = Fiscal deficit – Interest payments = 15000 – 25% of (70000 – 50000) = 15000 – 25% of 20000 = 15000 – 5000 = Rs. 10000 crore.
VII. Value Based Questions
Question 1. There has been consistent rise in prices of fruits and vegetables in Delhi for sometimes. Which measures of budget will you support to reduce the prices of these commodities? [ 1 Mark]
Answer: Prices of fruits and vegetables can be reduced by providing subsidies to the producer of fruits & Vegetables and the government should also provide fruits and vegetables at subsidised rates to the consumers through public distribution system.
Value : Problem solving
Question 2. Budget deficit creates disequilibrium in every economy, but in developing countries like India, why does government depend on it? [ 1 Mark]
Answer: Per capital income in developing countries like India is comparatively low so the tax receipts of the government are not sufficient, but on the other hand government has to incur heavy public expenditure for the development of economy so a government is compelled on budget deficit.
Value : Economic awareness
Question 3. In India a majority of population is lying below poverty line due to inequality of ‘Income and Wealth’. How can budget be helpful in solving this problem? [1 Mark]
Answer: In Indian budget progressive tax system can be a good measure to remove the inequality of ‘income and wealth’ and government should provide social facilities like education, health and food grain to the poor at subsidized rates.
Value : Problem solving.
Question 4. Classify the following items into revenue expenditure and capital expenditure. Give reason for your answer. [3-4 Marks]
(a) Free supply of stationary to the students by the government.
(b) Economic assistance given according to Ladli scheme.
(c) Expenditure on the construction of computer lab in school by the government.
(d) Expenditure on Mid Day Meal given to students by the government.
Answer: (a), (b) and (d) are revenue expenditures because they neither create assets nor cause reduction in assets.
(c) is capital expenditure because it increases assets of the government. Value : Analytic
Question 5. In India, for the last several years, there has been deficit in the revenue account. How is it met or financed? [1 Mark]
Answer: Two measures to reduce revenue : deficit:
- Government should reduce revenue expenditure.
- To increase taxes, both direct and ; indirect.
Value : Analytic
Question 6. If you were to be appointed as the Finance Minister of India, which taxes would you prefer: direct taxes or indirect taxes and why? [3-4 Marks]
Answer: As we know, direct tax and indirect tax are complimentary to each other i.e., they are not substitutes to each other. There is really nothing to choose between direct taxes and indirect taxes as such. Both of them have their relative merits and demerits.
They differ from each other as:
- Indirect taxes reach all the sections of the society; whereas direct taxes cannot reach all the sections.
- Direct taxes can be highly progressive; whereas Indirect taxes are generally proportional.
- Indirect taxes can be easily used to influence the consumption of specific commodities; whereas direct taxes cannot be used thus. In short, it is necessary to strike a balance between direct taxes and indirect taxes as a source of tax revenue.
Question 7. Should we rely exclusively on direct taxes for mobilizing tax revenue because indirect taxes are inequitable? Comment. [3 Marks]
Answer:
- We cannot depend solely on direct taxes because they are progressive in nature and there is possibility of tax evasion.
- But as against it indirect taxes are proportional in nature and are generally imposed on commodities (necessity goods etc.) which each and every individual purchase.
- So, direct and indirect tax are important for providing funds for investment and for other social welfare considerations.
Question 8. Levy of taxes on all commodities without caring for their impact on the common man is not desirable. Comment. [3 Marks]
Answer:
- Indirect taxes such as sales tax and excise duty fall heavily on the shoulders of a common man.
- This means they are inequitable.
- Therefore, in such a situation, tax basket should be a mixture of direct and indirect taxes both.
Question 9. It is not only difficult but impossible to tax all those who should be taxed, in India. Why? [ 1 Mark]
Answer: Due to lack of necessary information and disclosures required, tendency of the people to avoid taxes and lack of efficient implementation machinery, it is not possible to tax all those who should be taxed.
Question 10. In the government of India budget for the year 2013-14 the Finance Minister proposed to raise the excise duty on cigarettes. He also proposed to increase income tax on individuals earning more than ? One crore per annum.
Identify and explain the types of taxes proposed by the finance minister. Was the government’s objective only to earn revenue themselves? What possible welfare objective could the government be considering? Explain. [6 Marks] [CBSE Sample Paper 2014]
Answer: (a) Excise Duty: Indirect Tax When (a) liability to pay a tax (Impact of tax) is on one person; and(b) the burden of that tax (Incidence of tax), falls on the other person, it is termed as indirect tax.(b) Income Tax: Direct Tax When (a) liability to pay a tax (Impact of Tax), and (b) the burden of that tax (Incidence of tax), falls on the same person, it is termed as direct tax.(c) Besides the objective of raising more revenue, the proposals also serve some welfare objectives.
- First, raising excise duty on cigarettes makes cigarettes costlier and discourages smoking. Less smoking have positive influence on health and raises welfare of the people,
- Secondly, raising income tax on incomes above ? one crore will help in reducing inequalities in income.
- Thirdly, the extra revenue is raised from these proposals, and if spent on health and education of the poor it will do the welfare of the poor.
Question 11. Regulation of prices in the case of agricultural products is not only desirable but necessary. Explain. [3 Marks]
Answer:
- As we know that agricultural production depends upon natural factors like rainfall, climate etc. these natural factors creates a situation of drought or surplus production.
- Therefore, in such a situation for helping farmers in case of drought the government should fix a price lower than the market price (which is also known as price ceiling) and in case of the surplus production the government should fix a price higher than the market price (which is also known as price floor).
- Surplus or shortages should be met by the government from its buffer stock operations through Public Distribution System (PDS) such as ration shops or fair price shops.
Question 12. We should try to regulate interest rates prevailing among farmers, weaker sections of society and poor villagers. How can we control it? [3-4 Marks]
Answer:
- A government and monetary authorities fix the rate of interest which is based on bank rate fixed by the RBI and consequent interest rates are charged by the commercial banks.
- In this regard we have regional rural banks being set up in rural areas to benefit the rural artisans, small and marginal labourers and weaker sections of the society.
- They provide credit assistance at concessional lending rates.
- However, weaker sections of society including poor farmers and villagers pay very high rate of interest which they pay to the moneylenders or zamindars.
- Therefore, for reducing rate of interest for such people, some necessary steps should be taken such as promoting cooperative societies etc.
Class 12 Macro Economics Foreign Exchange Rate
Class 12 Macro Economics Chapter – 9 Foreign Exchange Rate
NCERT TEXTBOOK QUESTIONS SOLVED
Question 1. How is exchange rate determined under a flexible exchange rate regime? [6 Marks]
Or
How is foreign exchange rate determined? Explain with diagram.
Or [AI 2004; CBSE 06 q How is exchange rate determined in a foreign exchange market? Explain.[AI 2013 (Set 1)]
Answer:
- Exchange rate in a free exchange market is determined at a point, where demand for foreign exchange is equal to the supply of foreign exchange.
- Let us assume that there are two countries – India and U.S.A – and the exchange rate of their currencies i.e., rupee and dollar is to be determined.
Presently, there is floating or flexible exchange regime in both India and U.S.A. Therefore, the value of currency of each country in terms of the other currency depends upon the demand for and supply of their currencies. - In the above diagram, the price on the vertical axis is stated in terms of domestic currency (that is, how many rupees for one US dollar). The horizontal axis measures the quantity demanded or supplied.
- In the above diagram, the demand curve [D$] is downward sloping. This means that less foreign exchange is demanded as the exchange rate increases. This is due to the fact that the rise in price of foreign exchange increases the rupee cost of foreign goods, which make them more expensive. As a result, imports decline. Thus, the demand for foreign exchange also decreases.
The supply curve [S$] is upward sloping which means that supply of foreign exchange increases as the exchange rate increases. This makes home country’s goods become cheaper to foreigners since rupee is depreciating in value. The demand for our exports should therefore increase as the exchange rate increases. The increased demand for our exports translates into greater supply of foreign exchange. Thus, the supply of foreign exchange increases as the exchange rate increases.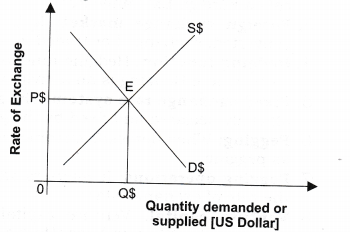 /li>
/li> - The intersection of the supply and demand curves determine equilibrium exchange rate (OP$) and equilibrium quantity [OQ$] of foreign currency i.e., US [$].
Question 2. Differentiate between devaluation and depreciation. [3 Marks]
Answer:

Question 3. Are the concepts of demand for domestic goods and domestic demand for goods the same? [3 Marks]
Answer:
- Demand for domestic goods and domestic demand for goods are two different concepts.
- Demand for domestic goods is a demand for goods made by both domestic and foreign countries.
- Domestic demand for goods is a demand for goods by our own country for goods ..which may be produced in foreign countries.
Question 4. Would the central bank need tointervene in a managed floating system? Explain why? [3 Marks]
Answer:
- In a managed floating system a central bank of a country has freedom to bring change in the exchange rate within certain limits.
- A country is allowed after information to the IMF to bring a certain limited amount of change in the rate of exchange.
- A central bank cannot bring change in its exchange rate by more than 10%. For it, permission of IMF is necessary.
MORE QUESTIONS SOLVED
I. Very Short Answer Type Questions (1 Mark)
Question 1. What is foreign exchange?[CBSE AI 2011, 04]
Answer: Foreign exchange refers to all the currencies of the rest of the world other than the domestic currency of the country. For example, in India, US dollar is foreign exchange.
Question 2. What is meant by foreign exchange rate? [CBSE 2004,05,06,09 2011, Sample Paper 2010]
Answer: The rate at which one currency is exchanged for another is called foreign exchange rate
Question 3. What is meant by foreign exchange market?
Answer: Foreign exchange market is the market where foreign currencies are bought and sold.
Question 4. Define flexible exchange rate system.[CBSE 2008]
Answer: Flexible exchange rate system refers to a system in which the exchange rate of different currencies is determined by the forces of demand and supply in foreign exchange market.
Question 5. The price of 1 US Dollar has fallen from Rs. 50 to Rs. 48. Has the Indian currency appreciated or depreciated?[CBSE Sample Paper 2010]
Answer: Indian currency has appreciated..
Multiple Choice Questions (1 Mark)
Question 1. Which function of foreign exchange market protects against the foreign exchange risk?
(a) Credit function
(b) Hedging function
(c) Transfer function
(d) All of them
Answer: (b)
Question 2. Reduction in the value of domestic currency by the government is called
(a) depreciation (b) devaluation
(c) revaluation (d) appreciation
Answer: (b)
Question 3. Reduction in the value of domestic currency through market forces is called ………….
(a) depreciation (b) devaluation
(c) revaluation (d) appreciation
Answer: (a)
Question 4. Increase in the value of domestic currency by the government is called
(a) depreciation (b) devaluation
(c) revaluation (d) appreciation
Answer: (c)
Question 5. Increase in the value of domestic currency through market forces is called _______ .
depreciation (b) devaluation
revaluation (d) appreciation
Answer: (d)
Question 6. What will be the effect on exports if foreign exchange rate increases? (a) Increases (b) Decreases
(c) Remains constant (d) None of them
Answer: (a)
Short Answer Type Questions (3-4 Marks)
Question 1. State four sources of demand of foreign exchange.[CBSE 2004, 05, 05C, 07; A 05, 10] Or
Give three reasons why people desire to have foreign exchange.
Or [CBSE 2005]
What are the sources of demand for foreign exchange?
Answer: The demand (or outflow) of foreign exchange comes from the people who need it to make payments in foreign currencies. It is demanded by the domestic residents for the following reasons:
- Imports of Goods and Services:When India import goods and services, foreign exchange is demanded to make the payment for imports of goods and services.
- Tourism: Foreign exchange is demanded to meet expenditure incurred in foreign tours.
- Unilateral Transfers sent abroad: Foreign exchange is required for making unilateral transfers like sending gifts to other countries.
- Purchase of assets in foreign countries: It is demanded to make payment for purchase of assets, like land, shares, bonds, etc. in foreign countries.
Question 2. What are the functions of a foreign exchange market?
Answer:
- Transfer Function: Transfer function refers to transferring of purchasing power among countries.
- Credit Function: It implies provision of credit in terms of foreign exchange for the export and import of goods and services across different countries of the world.
- Hedging Function: Hedging function pertains to protecting against foreign exchange risks. Where Hedging is an activity which is designed to minimize the risk of loss.
Question 3. Why does demand for foreign exchange rise when its price falls?
Or [AI 2006, 08, 10] What are the reasons for ‘Rise in Demand’ for Foreign Currency?
Answer: The demand for foreign currency rises in the following situations:
- When price of a foreign currency falls, imports from that, foreign, country become cheaper. So, imports increase and hence, the demand for foreign currency rises.
For example, if price of 1 US dollar falls from Rs 60 to T 55, then imports from The USA will increase as American goods will become relatively cheaper. It will raise the demand for US dollar. - When a foreign currency becomes cheaper in terms of the domestic currency, it promotes tourism to that country. As a result, demand for foreign currency rises.
- When price of a foreign currency falls, its demand rises as more people want to make gains from speculative activities.
Question 4. When price of a foreign currency rises, its demand falls’. Explain why?
Or [CBSE 2011]
Explain relation between foreign exchange rate and demand for it.
Or [CBSE 2004q Why demand curve of foreign exchange is downward sloping?
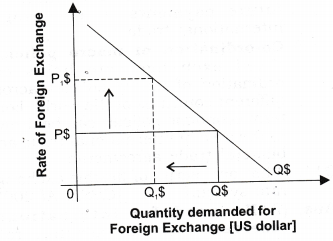
Answer:
- Demand curve of foreign exchange slopes downwards due to inverse relationship between demand for foreign exchange and foreign exchange rate.
- In figure, demand for foreign exchange (US dollar) and rate of foreign exchange are shown on the horizontal axis and vertical axis respectively.
- The demand curve [US$] is downward sloping. It means that less foreign exchange is demanded as the exchange rate increases.
- This is due to the fact that rise in the price of foreign exchange increases the rupee cost of foreign goods, which make them more expensive. As a result, imports decline. Thus, the demand for foreign exchange also decreases.
Question 5. State four sources of supply of foreign exchange.[CBSE 2004, 05, 05C, 07, 10; AI 05] Or
What are the sources for supply of foreign exchange?
Answer: The supply (inflow) of foreign exchange comes from the people who receive it due to the following reasons.
- Exports of goods and services:Supply of foreign exchange comes through exports of goods and services.
- Foreign investment: The amount, which foreigners invest in their home country, increases the supply of foreign exchange.
- Remittances (unilateral transfers) from abroad: Supply of foreign exchange increases in the form of gifts and other remittances from abroad.
- Speculation: Supply of foreign exchange comes from those who want to speculate on the value of foreign exchange.
Question 6. What are the reasons of ‘rise in supply’ of foreign currency?
Or
Why does a rise in foreign exchange rate cause a rise in foreign exchange supply? [CBSE 2006, 08]
Or
When exchange rate of a foreign currency rises, its supply also rises. How? Explain. [CBSE 2008]
Answer: The supply of foreign currency rises in the following situations:
- When price of a foreign currency rises, domestic goods become relatively cheaper. It induces the foreign country to increase their imports from the domestic country. As a result, supply of foreign currency rises. For example, if price of 1 US dollar rises from Rs 60 to Rs 65, then exports to USA will increase as Indian goods will become relatively cheaper. It will raise the supply of US dollars.
- When price of a foreign currency rises,foreign direct investment (FDI) from rest of the world increases, which will increase the supply for foreign exchange.
- When price of a foreign currency rises, also supply of foreign currency rises as people want to make gains from speculative activities.
Question 7. Why supply curve of foreign exchange is upward sloping?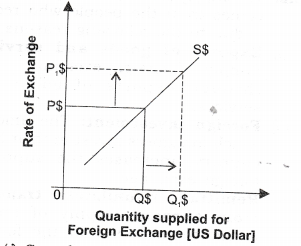
Answer:
- Supply curve of foreign exchange slopes upwards due to positive relationship between supply for foreign exchange and foreign exchange rate, which means that supply of foreign exchange increases as the exchange rate increases.
- This makes home country’s goods become cheaper to foreigners since rupee is depreciating in value. The demand for our exports should therefore increase as the exchange rate increases.
- The increased demand for our exports will translate into greater supply of foreign exchange. Thus, the supply of foreign exchange increases as the exchange rate increases.
Question 8. Explain the effect of depreciation of domestic currency on exports.
[A7 2013 (Set I), Sample Paper 2013]
Answer: Depreciation of domestic currency means a fall in the price of domestic currency (say, rupee) in terms of a foreign currency (say, $). It means, with the same amount of dollars, more goods can be purchased from India, i.e., exports to USA will increase as they will become relatively cheaper.
Question 9. Explain the effect of appreciation of domestic currency on imports.
[CBSE 2013 (Set I), Sample Paper 2013)]
Answer: Appreciation of domestic currency means a rise in the price of domestic currency (say, rupee) in terms of a foreign currency (say, $). Now, one rupee can be exchanged for more $, i.e., with the same amount of money, more goods can be purchased from the USA. It leads to increase in imports from the USA as American goods will become relatively cheaper.
Question 10. What are the merits of fixed exchange rate system? [CBSE 2009]
Answer:
- Stability: It ensures stability, in the international money market/ exchange market. Day to day fluctuations are avoided. It helps formulation of long term economic policies, particularly relating to exports and imports.
- Encourages international trade: Fixed exchange rate system implies low risk and low uncertainty of future payments. It encourages international trade.
- Co-ordination of macro policies:Fixed exchange rate helps co¬ordination of macro policies across different countries of the world. Long term economic policies can be drawn in the area of international trade and bilateral trade agreements.
Question 11. What are merits of flexible exchange rate system? [CBSE, AI 2009]
Answer:
- No need for international reserves: Flexible exchange rate system is not to be supported with international reserves.
- International capital movements: Flexible exchange rate system enhances movement of capital across different countries of the world. This is due to the fact that member countries are no longer required to keep huge international reserves.
- Venture capital: Flexible exchange rate promotes venture capital in foreign exchange market. Trading in international currencies itself becomes an important economic activity.
Question 12. Differentiate between fixed exchange rate and flexible exchange rate? [AI 2015]
Answer: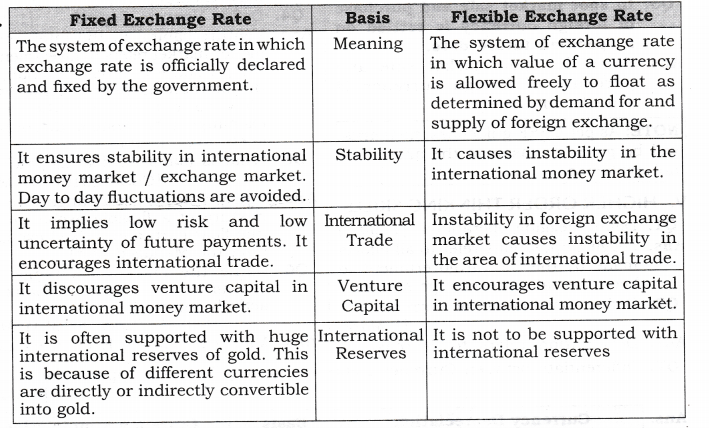
Question 13. Explain the meaning of Managed Floating Exchange Rate? [AI 2015]
Answer:
- Managed floating exchange rate is a mixture of a flexible exchange rate (the float part) and a fixed exchange rate (the Managed part).
- In other words, it refers to a system in which foreign exchange is determined by free market forces (demand and supply forces), which can be influenced by the invention of the central bank in foreign exchange market.
- Under this system, also called Dirty floating, central banks intervene to buy or sell foreign currencies in an attempt to stabilise exchange rate movements in case of extreme appreciation or depreciation.
IV. True Or False
Are the following statements true or false? Give reasons.
Question 1. An increase in demand for imported goods raises the supply for foreign exchange.
Answer: False. Supply of foreign exchange will decrease in order to make the payment for imported goods.
Question 2. Depreciation of Indian rupees will occur when Rs. 55 have to be paid to exchange one US $ instead of present rate of Rs. 50/$.
Answer: True. In case of depreciation, more rupees have to be paid to exchange one US dollar, i.e., greater than Rs. 50/$.
Question 3. Appreciation of domestic currency leads to rise in imports.
Answer: True. Appreciation of domestic currency makes foreign goods relatively cheaper, which leads to increase in imports.
Question 4. Revaluation and appreciation of currency are one and the same thing.
Answer: False. Revaluation refers to increase in the value of domestic currency by the government under fixed exchange rate. On the other hand, currency appreciation refers to increase in the value of domestic currency in terms of foreign currency under flexible exchange rate system.
Question 5. In spot market sale and purchase of foreign currency is settled on a specified future date.
Answer: False. In spot market sale and purchase of foreign currency is settled immediately.
NOTE: As per CBSE guidelines, no marks will be given if reason to the answer is not explained..
V. Higher Order Thinking Skills
Question 1. Define pegging operations. [1 Mark]
Answer: Pegging operations refer to all efforts made by the central government to keep the rate of exchange stable.
Question 2. Define devaluation of currency. [1 Mark]
Answer: Devaluation refers to decrease in the value of domestic currency by the government. It is a part of fixed exchange rate.
Question 3. Define revaluation of currency.
Answer: Revaluation refers to increase in the value of domestic currency by the central government. It is a part of fixed exchange rate.
Question 4. Define Venture Capital. [1 Mark]
Answer: Venture capital in the international money market refers to investments in the purchase of foreign exchange in the international money market with a view to earning profits. Fixed exchange rate system discourages such investments.
Question 5. What is managed floating rate?[CBSE 2010 ] [1 Mark]
Answer: Managed floating exchange rate is a mixture of a flexible exchange rate (the float part) and a fixed exchange rate( the Managed part).
Question 6. Name the market exchange rate system in which a central bank can actively intervene.[Sample Paper 2013] [1 Mark]
Answer: Managed Floating Exchange rate.
Question 7. Differentiate between Currency Depreciation and Currency Appreciation.[3 Marks]
Answer: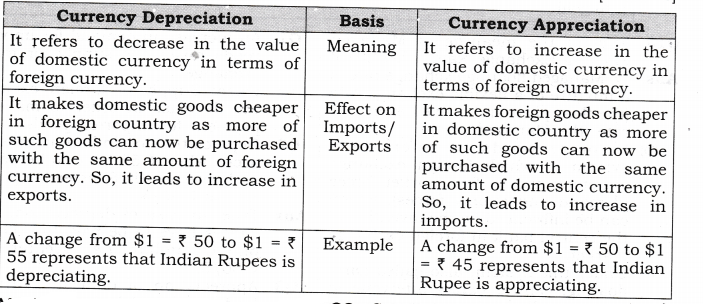
VI. Value Based Questions
Question 1. Do you think that a rise in BPO services a good source of supply of foreign currency? [1 Mark]
Answer: Yes, because it is a export of services and good source of foreign currency.
Value: Critical Thinking
Question 2. Suppose the present foreign exchange rate is 1$ = Rs 50 and if it rises to 1$ = Rs 60 should central bank intervene in the foreign exchange rate? [ 1 Mark]
Answer: Yes, Central Bank should intervene in order to safeguard the interest of the importers.
Value: Creative Thinking
Question 3. What impact will fall on the expenditure of an American citizen who comes to India for Medical treatment if foreign rate is increased? [1 Mark]
Answer: Expenditure on treatment will reduce because by the increasing foreign exchange rate, his purchasing power will increase.
Value: Empathy
Question 4. Why did India devalue its currency in 1991? [1 Mark]
Answer: India devalued its currency in 1991 to increase the flow of foreign exchange reserve.
Value: analytic
VII. Application Based Questions
Question 1. How can Reserve- Bank of India help in bringing down the foreign exchange rate which is very high?[AI 2013 (Set 1)] [1 Mark]
Answer: Reserve Bank of India can start selling the foreign currency from its reserves to increase its supply.
Question 2. What is the role of a Central Bank in the following exchange rate?[3 Marks]
(a) Fixed exchange
(b) Floating exchange
(c) Managed floating [CBSE Sample Paper 2014]
Answer: The role of the Central Bank in maintaining the foreign exchange rates under different regimes is:
- Fixed exchange rate system: A Central Bank actively uses its foreign currency reserves to maintain the officially determined exchange rate.
- Floating exchange rate system:A Central Bank does not maintain any reserves of foreign currency as the market automatically adjusts to determine the market driven exchange rate
- Managed Floating: A Central Bank enters the foreign exchange market to buy/sell foreign currency in order to control fluctuations and volatility in the market.
Question 3. ‘Devaluation and Depreciation of currency are one and the same thing’. Do you agree?
How do they affect the exports of a country? [CBSE Sample Paper 2016] [3 Marks]
Answer:
- Devaluation refers to reduction in price of domestic currency in terms of all foreign currencies under fixed exchange rate regime, i.e., (It takes place due to government) .
- Depreciation refers to fall in market price of domestic currency in terms of a foreign currency under flexible exchange rate regime, i.e., (It takes place due to market forces of demand and supply)
- Currency Depreciation and Currency Devaluation may result into increase in exports of the goods and services from the country since it would increase the global competiveness of the goods.
Class 12 Macro Economics Balance of Payment
Question 1. Differentiate between Balance of Trade and Current Account Balance.
[3 Marks] Or
Distinguish between BOT and Balance on current account.[AI 2008, CBSE 2013, Sample Paper 2013]
Answer:

Question 2. Should a current account deficit be a cause for alarm? Explain.[1 Mark]
Answer: No, if deficit in current account is offset by the capital account, otherwise such deficit has to be met by following which is a cause for alarm.
- Depleting Foreign Exchange reserves
- Taking foreign Loans.
Value: Analytic.
Question 3. If inflation is higher in country A than in country B, and the exchange rate between the two countries is fixed. What is likely to happen to the trade balance between the two countries?[1 Mark]
Answer: The exports from country B to country A will go up in this situation resulting in improvement or surplus trade balance for B. But due to higher price in country A, its imports will increase for country B and it will lead to deficit in trade balance for country A.
MORE QUESTIONS SOLVED
I.Very Short Answer Type Questions (1 Mark)
Question 1. What does balance of payments account of a country record? [CBSE 2007]
Answer: Balance of payments is an accounting statement that provides a systematic record of all the economic transactions between the residents of a country and the rest of the world during a given period of time.
Question 2. What is meant by visible items?
Answer: Visible items include material goods [such as sugar, cloth, machines etc.] which can be seen or touched, counted, measured and weighted and which are duly recorded at the custom barriers.
Question 6. Name the items included in balance of trade account. [CBSE 2007]
Answer:
- Exports of visible items (goods);
- Imports of visible items (goods).
Question 7. When will balance of trade show a deficit? [CBSE 2006]
Answer: When imports of visible items are more than exports of visible items.
Question 8. How is a deficit or a surplus on the current account restored?
Answer: Deficit on the current account is restored through the surplus on capital account and surplus on the current account is restored through the deficit on capital account.
II.Multiple Choice Questions (1 Mark)
Question 1.——————–is a systematic record of all the economic transactions between one country and rest of the world.
(a) Balance of trade
(b) Balance of transactions
(c) Budget
(d) Balance of payments
Answer: (d)
Question 2. If India exports goods worth Rs 20 crore and imports goods worth Rs 30 crore, it will have a———————-.
(a) surplus of Rs 10 crore in balance of trade
(b) deficit of Rs 10 crore in balance of trade
(c) deficit of ? 50 crore in balance of trade
(d) can’t say
Answer: (b)
Question 3. Which one of the following items is an intangible item in balance of payments statement?
(a) Export of food grains
(b) Import of crude oil
(c) Banking services provided in other countries
(d) Import of steel by steel industry
Answer: (c)
Question 4. Which one of the following statements
deals with debts and claims of a country?
(a) Balance of capital account
(b) Balance of trade account
(c) Balance of current account
(d) Balance of services
Answer: (a)
Question 5. Name the economic transactions which are undertaken to make equilibrium in balance of payment,
(a) Autonomous items
(b) Accommodating items
(c) Invisible items
(d) None of them
Answer: (b)
Question 6. Current account of BOP records transactions is relating to——————.
(a) exchange of goods
(b) exchange of services
(c) unilateral transfers
(d) all of them
Answer: (d)
Question 7. Current transactions are of————-.nature.
(a) flow
(b) stock
(c) both flow and stock
(d) none of the above
Answer: (a)
Question 8. Capital account may be ————–.
(a) private capital
(b) banking capital
(c) official capital
(d) all of them
Answer: (d)
III.Short Answer Type Questions (3-4 Marks)
Question 1. State four items of current account of BOP account.[CBSE 2004, 08, 08C, 09; AI 05]
Or
Name the broad categories of transactions recorded in the Current account of the balance of payment accounts. [CBSE 2015]
Answer: Current account records imports and exports of goods and services and unilateral transfers.
Components of Current Account The main components of Current Account are:
- Export and Import of Goods (Merchandise Transactions or Visible Trade): A major part of transactions in foreign trade is in the form of export and import of goods (visible items). Payment for import of goods is written on the negative side (debit items) and receipt from exports is shown on the positive side (credit items). Balance of these visible exports and imports is known as balance of trade (or trade balance).
- Export and Import of Services (Invisible Trade): It includes a large variety of non-factor services (known as invisible items) sold and purchased by the residents of a country, to and from the rest of the world. Payments are either received or made to the other countries for use of these services. Services are generally of three kinds: (a) Shipping,
(b) Banking, and (c) Insurance. Payments for these services are recorded on the negative side and receipts on the positive side. - Unilateral or Unrequisted Transfers to and from abroad (One sided Transactions): Unilateral transfers include gifts, donations, personal remittances and other ‘one-way’ transactions. These refer to those receipts and payments, which take place without any service in return. Receipt of unilateral transfers from rest of the world is shown on the credit side and unilateral transfers to rest of the world on the debit side.
- Income receipts and payments to and from abroad: It includes investment income in the form of interest, rent and profits.
Question 2. What do you mean by capital account and what are its components?
Or
State four items (components) of capital account of BOP account.[CBSE 2004, 11, AI 05]
Or
Name the broad categories of transactions recorded in the Capital account of the balance of payment accounts. [CBSE 2015]
Answer: Capital account is that account which records all such transactions between residents of a country and rest of the world which cause a change in the asset or liability status of the residents of a country or its government.
Components of Capital Account
The main components of capital account are:
- Loans: Borrowing and lending of funds are divided into two transactions:
(a) Private Transactions
• These are transactions that are affecting assets or liabilities by individuals, businesses, etc. and other non-government entities. The bulk of foreign investment is private.
• For example, all transactions relating to borrowings from abroad by private sector and similarly repayment of loans by foreigners are recorded on the positive (credit) side.
• All transactions of lending to abroad by private sector and similarly repayment of loans to abroad by private sector is recorded as negative or debit item.
(b) Official Transactions
• Transactions affecting assets and liabilities by the government and its agencies.
• For example, all transactions relating to
borrowings from abroad by government sector and similarly repayment of loans by foreign government are recorded on the positive (credit) side.
• All transactions of lending to abroad by government sector and similarly repayment of loans to abroad by government sector is recorded as negative or debit item. - Foreign Investment (Investments to and from abroad) It includes:
(a) Investments by rest of the world in shares of Indian companies, real estate in India, etc. Such investments from abroad are recorded on the positive (credit) side as they bring in foreign exchange.
(b) Investments by Indian residents in shares of foreign companies, real estate abroad, etc. Such investments to abroad are recorded on the negative (debit) side as they lead to outflow of foreign exchange. - Change in Foreign Exchange Reserves
(a) The foreign exchange reserves are. the financial assets of the government held in central bank. A change in reserves serves as the financing item in India’s BOP.
(b) So, any withdrawal from the reserves is recorded on the positive (credit) side and any addition to these reserves is recorded on the negative (debit) side.
(c) It must be noted that ‘change in reserves’ is recorded in the BOP account and not ‘reserves’.
Question 3. Distinguish between current account and capital account of BOP account.[AI 2004, 06 C]
Answer: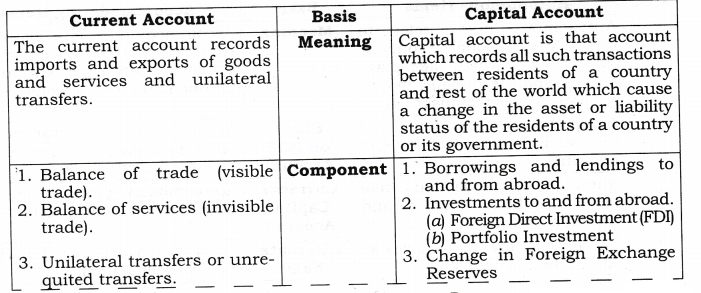
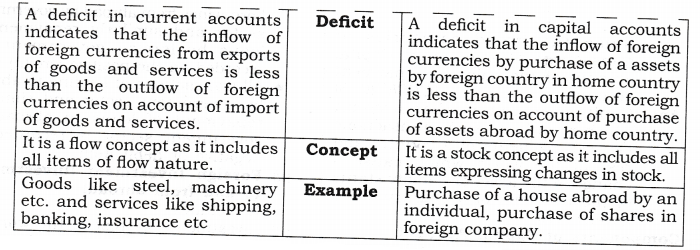
Question 4. Distinguish between balance of trade and balance of payment. [AI 2004, 06C]
Answer: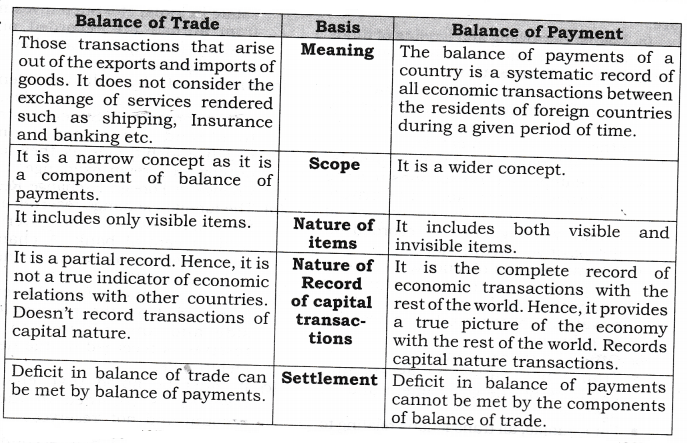
Question 5. Distinguish between autonomous and accommodating transactions of BOP account. ” [AI 2010; CBSE 10, 13C]
Answer: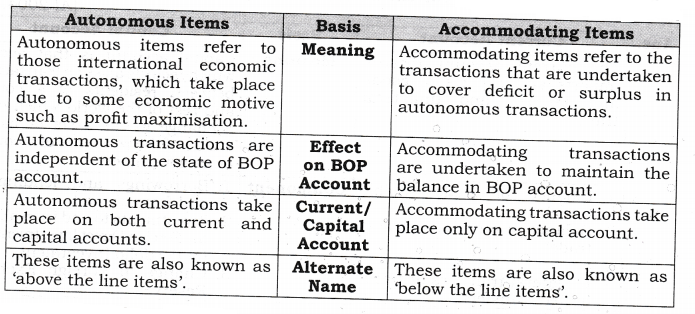
Question 6. Where is ‘borrowings from abroad’ recorded in the Balance of Payments Accounts? Give reasons. [AT 2015]
Answer:
- Borrowing from abroad is a part of Capital Account.
- Borrowing from abroad can be private transactions or official transactions.
- For example,
(a) All transactions relating to borrowings from abroad by private sector are recorded on the positive (credit) side as it is inflow of foreign currency.
(b) Similarly, transactions relating to borrowings from abroad by government sector are recorded on the positive (credit) side as it is inflow of foreign currency.
Question 7. Where will sale of machinery to abroad be recorded in the balance of payment accounts? Give reasons. [CBSE 2015]
Answer:
- Sale of machinery to abroad is a part of Current accounts.
- Current account records imports and exports of goods and services and unilateral transfers.
- Sale of machinery to abroad leads to inflow of foreign currency and receipt from exports is shown on the positive side (credit items).
Question 8. What is meant by ‘official reserve transactions’? Discuss their importance in Balance of Payments.[CBSE Sample Paper 2016]
Answer:
- Official reserve transactions are those transactions by a central bank that cause changes in its official reserves.
- It is sale or purchase of its own currency in the exchange market in exchange for foreign currencies.
- So, any withdrawal from the reserves is recorded on the positive (Credit) side and any addition to these reserves is recorded on the negative (debit) side.
- They may be Autonomous and Accommodating Transactions.
IV. True Or False
Giving reasons, state whether the following statements are true or false.
Question 1. In balance of payments, repayment of loans by Indian Government to American Government will be reflected as debit item.
Answer: True. It is so because it leads to outflow of foreign exchange.
Question 2. Accommodating items of trade are undertaken in order to maintain the balance in the BOP account.
Answer: True. Accommodating transactions are net consequences of autonomous transactions that are undertaken to correct disequilibrium in autonomous items of BOP.
Question 3. Excess of foreign exchange payments on account of accommodating transactions equals deficit in BOP.[CBSE 2011 ]
Answer: False. Excess of foreign exchange payments on account of autonomous transactions equals deficit in BOP.
Question 4. Export and import of machines are recorded in capital account of BOP account. [CBSE 2011 ]
Answer: False. Export and import of machines are considered as export and import of goods, that comes under current account of BOP account.
Question 5. Foreign exchange received on account of export of sugar will be X’ecorded in current account.
Answer: True. It is so because export of sugar is a export of goods which is a component of current account.
Question 6. Accommodating items are also known as ‘above the line’ items.
Answer: False. Accommodating items are also known as ‘below the line’ items. (Autonomous items are also known as ‘above the line’ items.)
Question 7. Unilateral transfers received from abroad will be recorded as a credit item of BOP on current account.
Answer: True. It leads to inflow of foreign exchange.
Question 8. Borrowing by government from World Bank to finance the BOP deficit will be recorded in the capital account.
Answer: True. Borrowing by the government is a accommodating transaction and it is recorded in the capital account only.
Question 9. Autonomous transactions take place in current account only.
Answer. False. Autonomous transactions take place in both current and capital accounts.
Note: As per CBSE guidelines, no marks will be given if reason to the answer is not explained.
V. Higher Order Thinking Skills
Question 1. What does deficit in a current account indicate? [1 Mark]
Answer: A deficit in a current account indicates that the inflow of foreign currencies from exports of goods and services is less than the outflow of foreign currencies on account of import of goods and services.
Question 2. What does deficit in capital accounts indicate? [ 1 Mark]
Answer: A deficit in capital accounts indicates that the inflow of foreign currencies by purchase of an assets by a foreign country in home country is less than the outflow of foreign currencies on account of purchase of assets abroad by home country.
Question 3. Explain the meaning of deficit in BOP. [CBSE 2010, AI 13] [3-4 Marks]
Answer:
- The balance of payments of a country is a systematic record of all economic transactions between the residents of foreign countries during a given period of time.
- The transaction in the balance of payment account can be categorized as autonomous transactions and accommodating transactions.
- Autonomous transactions are transactions done for some economic consideration such as profit.
- When the total inflows on account of autonomous transactions are less than total outflows on account of such transactions, there is a deficit in the balance of payments account.
- Suppose, the autonomous inflow of foreign exchange during the year is $500, while the total outflow is $600. It means that there is a deficit of $100.
Question 4. The balance of trade shows a deficit of Rs 5,000 crore and the value of imports are Rs 9,000 crore. What is the value of exports? [CBSE 2004] [3 Marks]
Answer: Balance of Trade = -Rs 5,000 crore Value of Imports = Rs 9,000 crore Balance of trade (Deficit) = Value of Exports – Imports Value of Exports = Balance of trade (Deficit) + Imports = -Rs 5,000 crore + Rs 9,000 crore = Rs 4,000 crore
Question 5. The balance of trade shows a deficit of Rs 300 crore. The value of exports is Rs 500 crore. What is the value of imports? [CBSE 2004][3 Marks]
Answer: Balance of Trade = -Rs 300 crore Value of exports = Rs 500 crore Balance of trade (Deficit) = Value of Exports – Imports
Imports = Exports – Balance of trade ((deficit)
= Rs 500 crore – (-Rs 300 crore)= Rs 800 crore
VI. Application Based Questions
Question 1. How can increase in foreign direct investment affect the price of foreign exchange? [CBSE 2013 (Set I)][l Mark]
Answer: Increase in foreign direct investment can affect the price of foreign exchange because increase in foreign direct investment raises the supply of foreign exchange that lowers the price of foreign exchange.
Question 2. State whether the following transactions will be recorded on debit or credit side of BOP. [3-4 Marks]
- Loan from IMF to cover deficit of BOP.
- Indian Government repays loan taken from IMF.
- Purchase of shares of Infosys by a Japanese resident.
- Export of Jute to Sri Lanka.
- Acquisition of a foreign company by Tata.
- Purchase of toys from China.
Answer: Transactions relating to inflow of foreign exchange will be recorded on the credit side and outflows of foreign exchange on the debit side. Debit Side: (2), (5), (6); and Credit Side: (1), (3), (4).
Question 3. Identify the following items as visible items or invisible items. [3-4 Marks}
- Export of computer software
- Import of LCD screen from Malaysia
- Banking service to NRI
- Export of Tea to Thailand
- Consultancy services of TCS used by a foreign firm
Answer: Visible Items: (2), (4); Invisible Items: (1), (3), (5).
Question 4. Classify whether the following transactions will be recorded in current account or capital account. [3-4 Marks]
- Purchase of shares of Tata by Microsoft.
- Imports of computer spare parts from America.
- Borrowings from World Bank.
- Repayment of loan by Indian Government taken from Japan.
- Gifts received from a relative in Australia.
- Purchase of Land in China.
- Import of machinery.
Answer: Current Account: (2), (5), (7); Capital Account: (1), (3), (4), (6).


0 Comments